
Technology explained · 4 October 2026
Whitening Does Not Equal Greater Whiteness: Criteria for Interpreting Hiding Power, Tinting Strength, and Dispersibility
If whiteness does not improve after whitening, this does not necessarily mean that the wrong additive was used. Hiding power, tinting strength, and dispersibility each have their own test methods and interpretation criteria. Based on the source text of the manual, this article distinguishes 3 evaluation pathways and reproducible criteria, using 21 measured data points from the R1800-SK titanium dioxide study to show that lightness, Tappi whiteness, and yellowness no longer change synchronously after 1.6%. It also identifies 12 common misconceptions, 2 data-layer usage cautions, and a clear boundary between verifiable and non-verifiable information.
- 01Anti-agglomeration
- 02Distribution rate
- 03Lubrication balance
Moved from the bodyFirst data table in this article (as quoted)
| Term | Occurrences in Hyperdispersant Series | Occurrences in Functional Additives | Application |
|---|---|---|---|
| Hiding power | 22 | 22 | Indicator name; usable |
| Tinting strength | 8 | 8 | Indicator name; usable |
| Colouring rate | 2 | 2 | ⚠️ Appears only in the R1800-SH and R6800 entries; not an independent indicator term; each quotation must identify the applicable model |
| Dispersibility | 62 | 75 | Capability descriptor; "dispersibility" in this article always refers to this term |
| Degree of dispersion | 9 | 9 | Grading item in the physicochemical tables |
| Distribution rate | 0 | 1 | ⚠️ Appears in the heading of a mechanism passage concerning "improving the distribution rate of pigment filler in resin"; it is a mechanism description, not an indicator |
After white masterbatch, white filling masterbatch, or liquid colour is added, hiding power increases in the data and the surface appears brighter, but customers report that it is "not whiter." At this point, 2 mistakes are most likely: continuing to increase the dosage, or replacing the dispersant with one from another brand. Neither approach is supported by the data. The scope of this article covers only white masterbatch and liquid colour systems. Black masterbatch is characterized by blackness, and the source text does not provide conversion criteria across substrates or colour concentrations; no extrapolation is therefore made in this article.
The 2 documents cited in this article are the official manuals Californium Curium – Hyperdispersant Series and Californium Curium – Functional Additives, referred to below as the "Hyperdispersant Manual" and the "Functional Additives Manual," respectively. The paragraphs cited in this article are identical in both manuals, which can therefore serve as mutual backups. Any item not documented in the manuals is stated as "not provided in the source text." No assumptions or fill-in values are used.
First, consider the data from a single experiment. Titanium dioxide was treated with R1800-SK hyperdispersant under constant conditions of PH=6.8 and 70℃, with the dosage increasing from 0 to 2.0%:
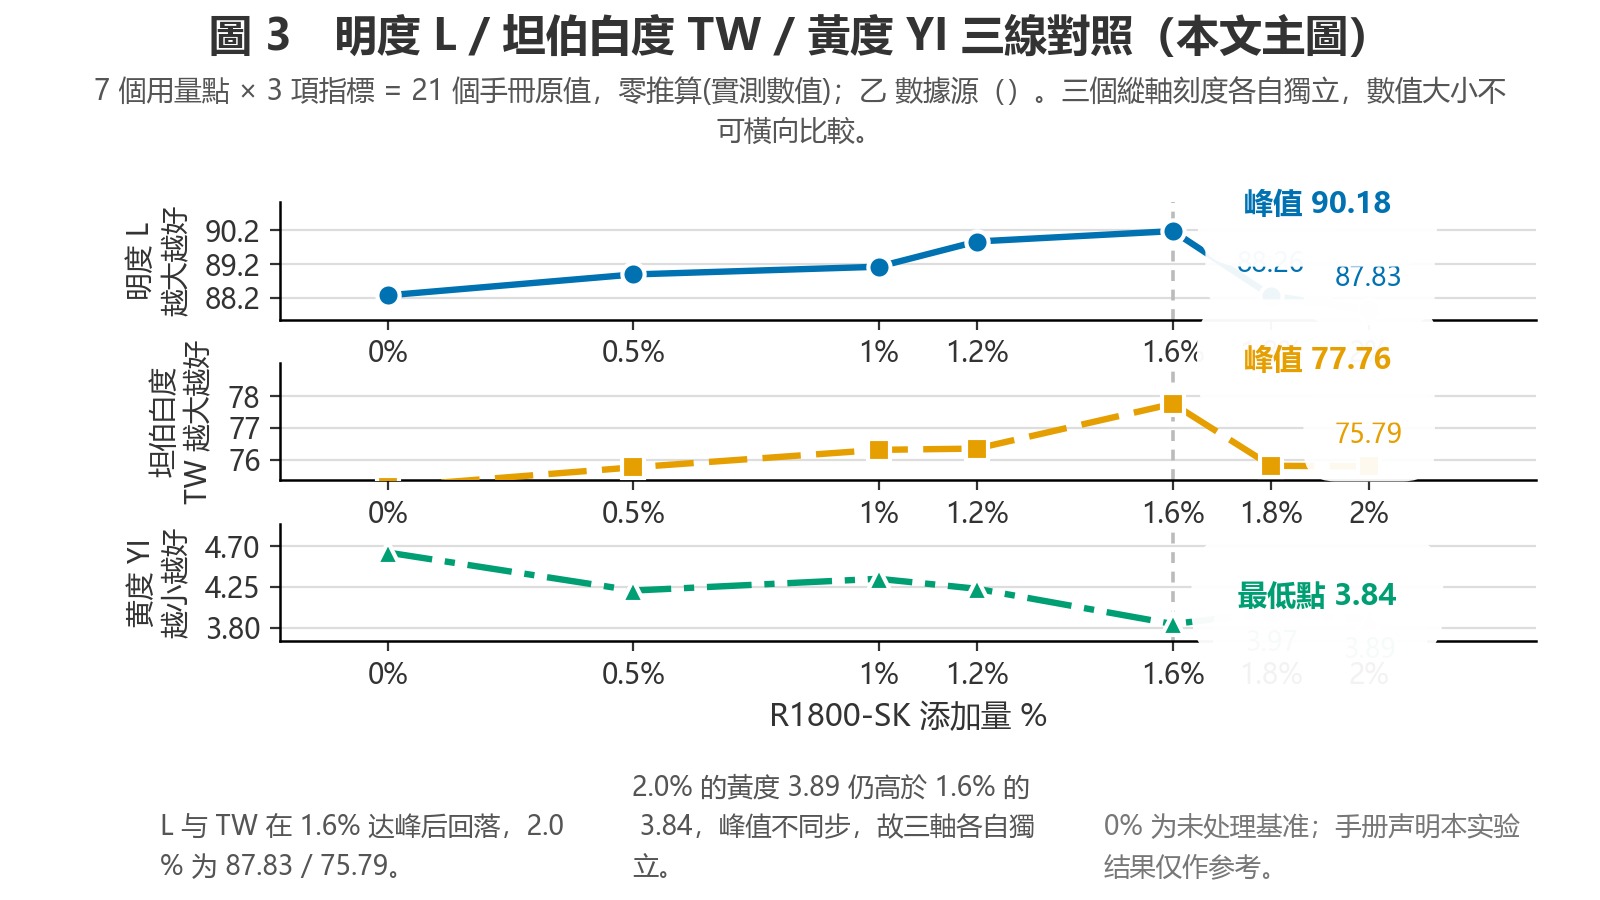
At 1.6%, all 3 indicators reach their optimum values within the experimental sequence. With further addition, L and TW decline continuously, whereas YI rises to 3.97 at 1.8% and remains at 3.89 at 2.0%, both higher than 3.84 at 1.6%. The 3 curves no longer change synchronously after 1.6%. This is measured evidence that "adding more ≠ being better in all respects" and requires no calculation. However, this "optimum point" applies only under the specific conditions of PH=6.8, 70℃, and the experimental range of 0.3%–2%. The manual does not provide replicate readings at other temperatures, pH levels, or substrate systems.
Next, consider liquid colour. The source text states regarding R900A (a base material specifically for liquid colour): "Liquid colour exhibits excellent dispersion performance. Compared with colour powder and colour masterbatch, liquid colour provides higher tinting strength and hiding power, and the plastic finished articles produced exhibit higher gloss." It also states: "Liquid colour effectively eliminates colour spots and speckling problems on the surfaces of finished articles."
Note that this passage contains no reference to "whiteness." The manual does not state that liquid colour is whiter, and the R900A entry contains no data for whiteness, lightness, yellowness, or optical density. No basis is provided in the source text for the customer statement that "the product became whiter after liquid colour was added." The benefits attributed to liquid colour are reduced speckling, improved uniformity, higher hiding power and tinting strength, and higher gloss, rather than greater whiteness.
Accordingly, "whitening ≠ greater whiteness" is not promotional language; it is supported by the 3 curves themselves. To explain it clearly, the test methods and interpretation directions of the 3 indicators must first be considered separately. All figures, units, and quotations in this article are taken exclusively from the 2 official manuals and the official website data layer, and each can be traced back to its source. Information not documented in the manuals is stated as "not provided in the source text."
The 3 Indicators Each Have Their Own Test Methods
1.1 Hiding Power: Test the Film, Examine Optical Density; a Higher Value Indicates Better Performance
The manual defines the indicator verbatim as follows:
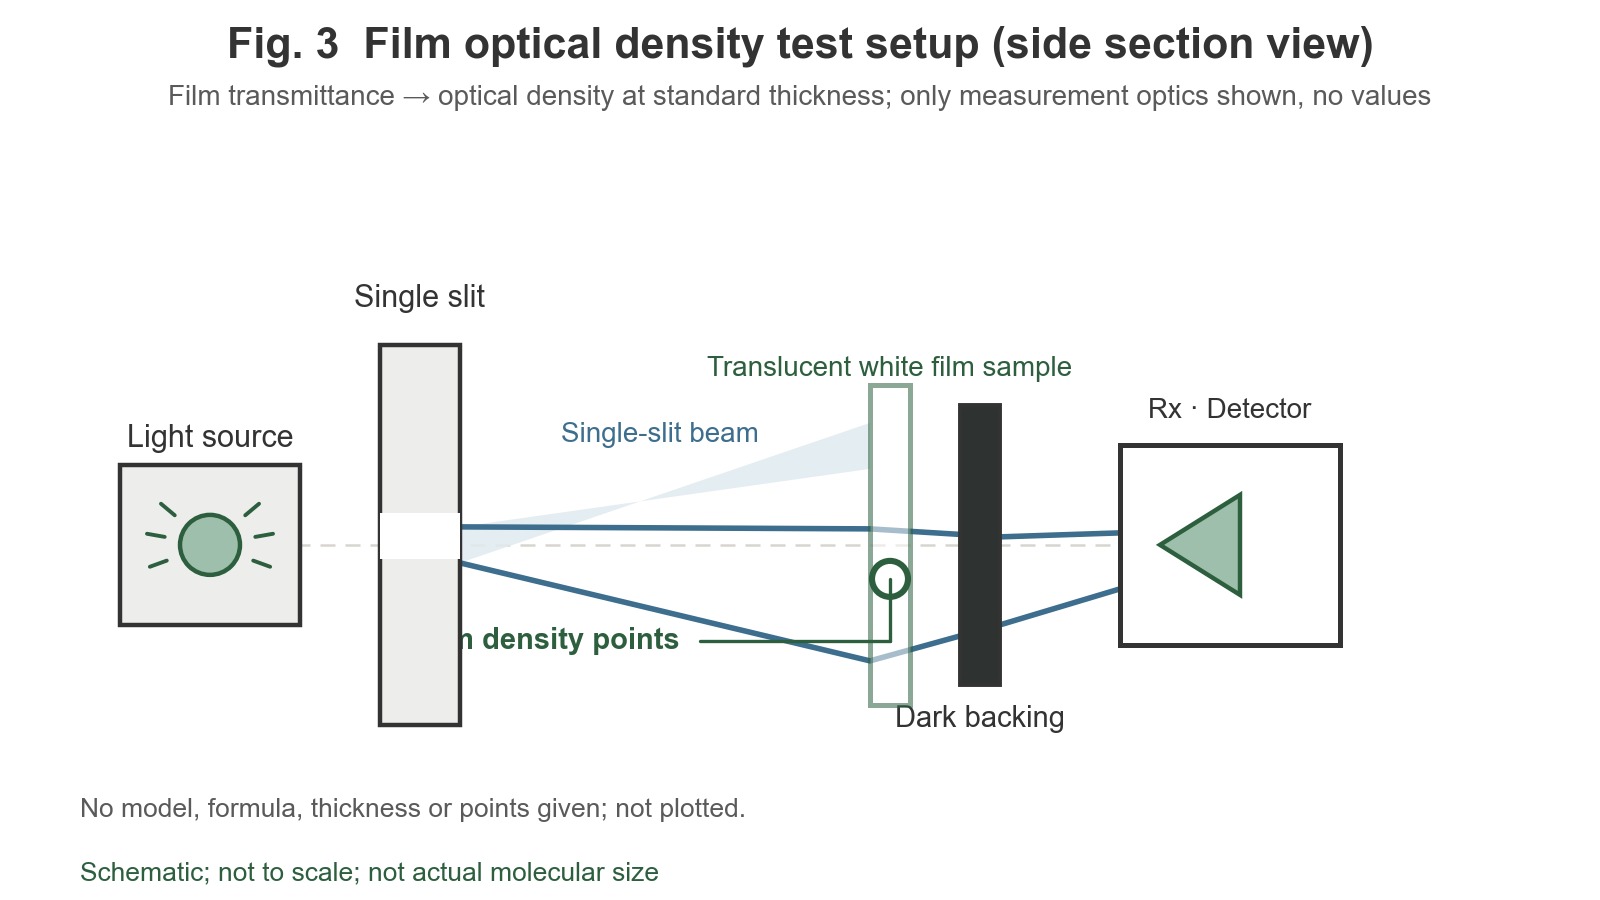
"Hiding power refers to the ability of a pigment to obscure the base colour of the substrate being coloured. A masterbatch is prepared using titanium dioxide pretreated with different concentrations of hyperdispersant, after which a film is blown. The transmittance of the film is measured and converted to the optical density value at a standard film thickness (0.02mm), hereafter referred to as the optical density value. The higher the optical density value, the higher the hiding power." —— Source: "Hiding Power" definition section in both the Hyperdispersant Series and Functional Additives manuals; identical wording.
There are 3 reproducible criteria for evaluation:
The manual describes the influencing factors as follows:
"The dispersion level of a pigment is the primary factor affecting hiding power. The more uniformly a pigment is dispersed and the finer its particles, the higher the optical density value; the relationship is otherwise reversed." —— Source: "Factors Affecting Hiding Power" section in both manuals.
2 points require attention: the instrument list specifies a photoelectric spectrophotometer, but the model is not provided; and the conversion formula from transmittance to optical density value is not provided. The dimensional expression for the optical density value is not provided in the source text; the manual only states "optical density value (hereinafter referred to as the optical density value)."
1.2 Tinting Strength: Test Panels and Examine TW / L / YI; Yellowness Is Interpreted in the Opposite Direction
The manual defines the indicator verbatim as follows:
"Tinting strength refers to the ability of a pigment to impart colour. The tinting strength of titanium dioxide in plastics can be characterized by whiteness; the higher the whiteness, the higher the tinting strength of the titanium dioxide. White masterbatch is prepared using differently pretreated pigments, after which test panels are produced and their whiteness (using Tappi whiteness TW as the reference), lightness (L), yellowness (YI), and other values are measured using a colour difference meter." —— Source: "Tinting Strength" definition section in both the Hyperdispersant Series and Functional Additives manuals; identical wording.
The reproducible criteria for evaluation are as follows:
- What is measured: Readings from a colour difference meter after test-panel production, rather than a film. The substrate, wall thickness, and sample-preparation equipment conditions for the panels are not provided in the source text; therefore, the following readings can only be compared horizontally within the same panel-based test protocol
- Indicators used: Tappi whiteness TW (as the reference), lightness L, and yellowness YI
- Direction of interpretation: A higher whiteness value = higher tinting strength, indicating a direct relationship. A lower yellowness value is preferable. The manual states: "Yellowness indicates the degree of yellowing of a sample. For white masterbatch, a lower yellowness value is preferable."
A parallel definition applies to black systems and is provided here for comparison. It must not be combined with calculations for white systems:
"Tinting strength refers to the ability of a pigment to impart colour. The tinting strength of carbon black in plastics can be characterized by blackness; the higher the blackness, the higher the tinting strength of the carbon black." —— Source: "Carbon Black Tinting Strength" definition section in both manuals.
The following statement concerning the influencing factors provides the most direct manual basis for the proposition that whitening does not equal greater whiteness:
"The tinting strength of a pigment primarily depends on the inherent properties of the pigment, but is also affected by pigment dispersion, and is characterized primarily by the brightness (lightness) and whiteness of the sample." —— Source: "Factors Affecting Tinting Strength" section in both manuals.
The primary determining factor is the pigment itself; dispersion is only an additional influence. Likewise, the test standard numbers for TW / L / YI are not provided in the source text. The manuals merely state that a colour difference meter was used and do not cite any standard, such as GB/T. Without standard numbers or repeatability data, the absolute values of these 3 indicators generally cannot be compared directly across manufacturers or instruments. This article therefore limits its interpretation to relative comparisons within the same test group.
1.3 Dispersibility / Degree of Dispersion: Microscopic Observation and Particle-Size Distribution
The manual defines the indicator verbatim as follows:
"Dispersibility refers to the ability of a pigment to disperse in the medium being coloured. Methods for characterizing and qualitatively evaluating dispersibility include observation and photography using a phase-contrast microscope or an electron microscope; quantitative evaluation is performed by measuring the particle-size distribution." —— Source: "Dispersibility" definition section in both the Hyperdispersant Series and Functional Additives manuals; identical wording.
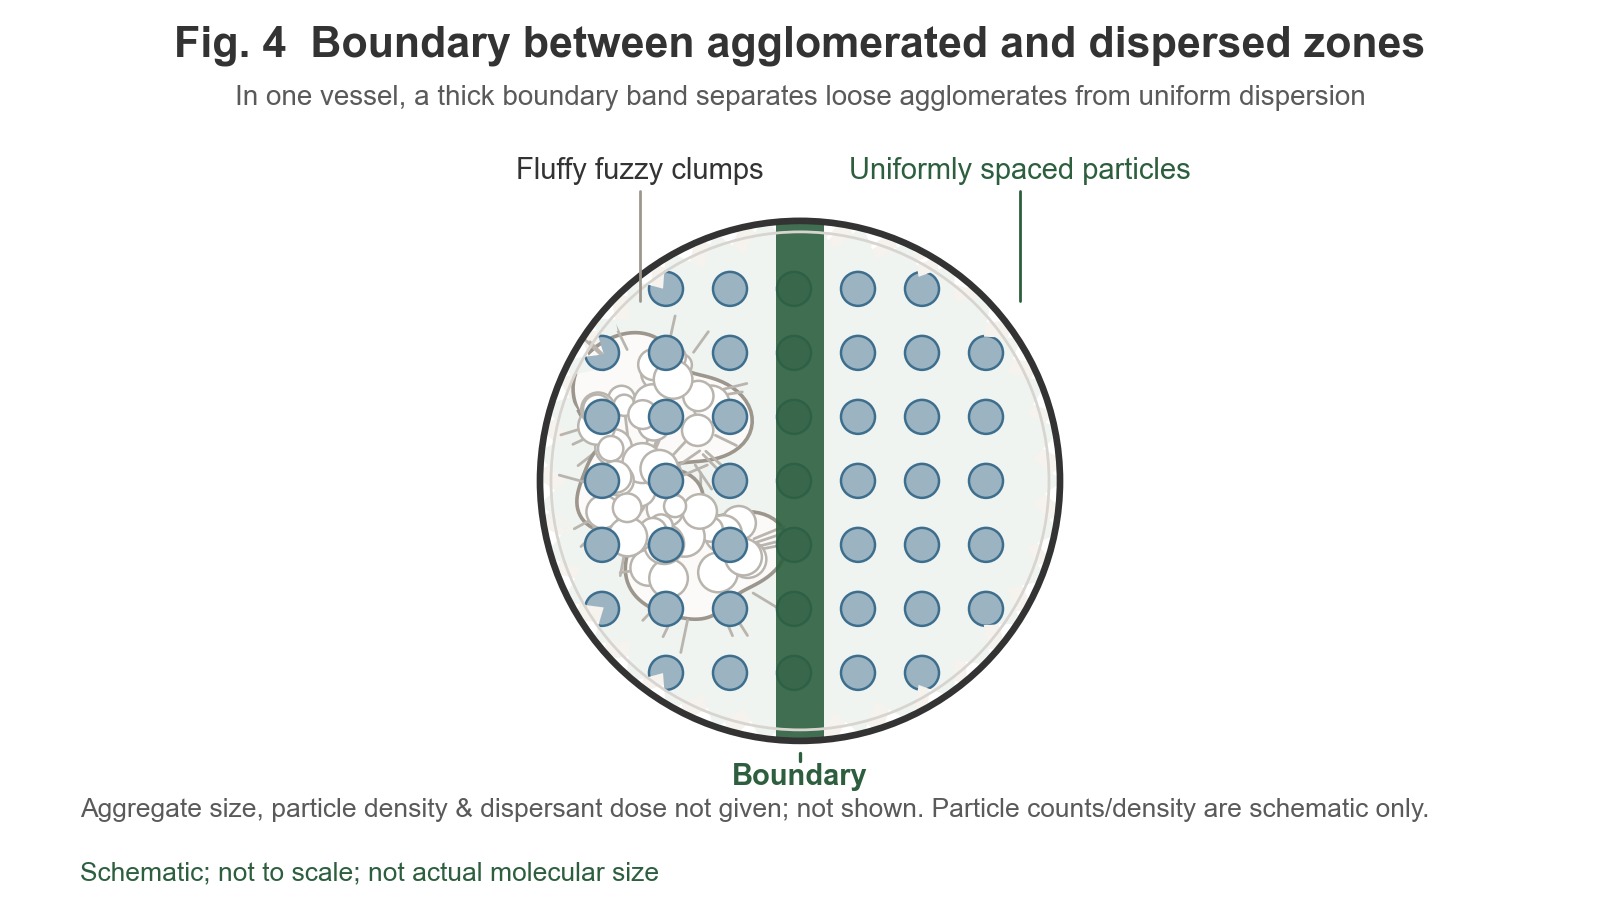
There are 2 evaluation pathways: qualitative evaluation = observation and photography using a phase-contrast microscope or electron microscope; quantitative evaluation = measurement of the particle-size distribution. The manual does not provide a numerical scoring method for dispersibility; it provides only these 2 pathways, with no scoring criteria or thresholds. Each pathway has its own evaluation prerequisites. The microscopic observation pathway depends on the observation magnification and the evaluator, while the particle-size distribution pathway depends on the instrument and statistical method. These specific conditions are not provided in the source text. Consequently, an improvement in "dispersibility" can only be interpreted directionally and cannot be reported numerically.
The manual provides the following qualitative comparison verbatim:
"Figure A shows surface-treated titanium dioxide prepared using R1800-SK hyperdispersant at a dosage of 1.6%, pH=6.8, and 70℃ ethanol at 2%. B shows untreated titanium dioxide. It can be seen that the dispersion in Figure A is relatively uniform and the titanium dioxide particles are smaller; in Figure B, severe agglomeration of the titanium dioxide particles occurs. Therefore, treating titanium dioxide with R1800-SK hyperdispersant significantly improves its dispersibility." —— Source: R1800-SK dedicated experimental section (microscopic comparison) in both manuals.
⚠️ Quoting-fidelity note: in the passages quoted above and below, the manual's original Chinese contains an evident misprint — a character meaning "end of" stands where "not yet" is intended. The translation renders the intended meaning ("untreated"); the misprint is flagged here rather than silently corrected, and the wording is otherwise reproduced without alteration. The same misprint occurs in the data-layer sentence "both are higher than the corresponding values for untreated pigment", which likewise reproduces the original manual text.
1.4 A Term That Must First Be Clarified
The term commonly used in the industry is found 0 times in either official manual. It is "dispersion rate." The source material contains 2 native terms:
This article consistently uses the native terms in the source material. The rejected industry term "dispersion rate" appears only in 2 places in this section as a negative reference and is not used as an indicator anywhere in this article.
"Degree of dispersion" is a separate concept. It is a grading item in the physicochemical tables: the [Physicochemical Properties] tables for R1800-S / R1800-SK / R1800-SH all state "degree of dispersion: III," while R188 (waterborne coating) states "degree of dispersion: ‖." The manuals never define the grading method for "degree of dispersion". The meanings of III and ‖ and the particle-size ranges corresponding to each grade are not provided in the source text.
The only degree-of-dispersion test for which the manual provides a complete quantitative algorithm is water dispersibility, used for a titanium dioxide system and based on the ratio of slurry concentrations before and after sedimentation:
Purpose: "To examine the dispersibility of chemical-fibre titanium dioxide powder in water." Principle: "The sample is agitated under electromagnetic stirring to form an aqueous slurry, which is poured into a sedimentation tube used to determine degree of dispersion. After standing for a specified period, the ratio of slurry concentrations before and after sedimentation is measured." Formula:water dispersibility% = (m3/m4) / (m2/m1) × 100Manual example:M1=24.24 M2=1.18 M3=23.26 M4=1.09→1.09/23.26 = 0.047;1.18/24.24 = 0.049→0.049/0.047 × 100 = 95.9—— Source: Water dispersibility test section and calculation example in the Hyperdispersant Series manual; corresponding section in the Functional Additives manual. Both manuals provide identical wording.
The entry must be identified when quoting this passage: the source algorithm belongs to the RPEG20 coating agent entry (comparison row for RPEG20 and R1800 at 1%), not to the R1800-SK dedicated study.
1.5 The Relationships Among the 3 Indicators Are Supported Entirely by the Manuals and Are Not Inferences
| Relationship | Manual wording | Manual location |
|---|---|---|
| Hiding power ← dispersion level | "The dispersion level of a pigment is the primary factor affecting hiding power" | "Factors Affecting Hiding Power" section in both manuals |
| Tinting strength ← primarily the inherent properties of the pigment, with dispersion as a secondary influence | "The tinting strength of a pigment primarily depends on the inherent properties of the pigment but is also affected by pigment dispersion" | "Factors Affecting Tinting Strength" section in both manuals |
| 3-stage dispersion process | "The pigment dispersion process can be divided into 3 parts: wetting, refinement (dispersion), and stabilization after refinement (coating). Pigment surface treatment is the process of stabilizing the pigment after refinement" | "Dispersion Process" section in the Hyperdispersant Series manual; corresponding section in the Functional Additives manual |
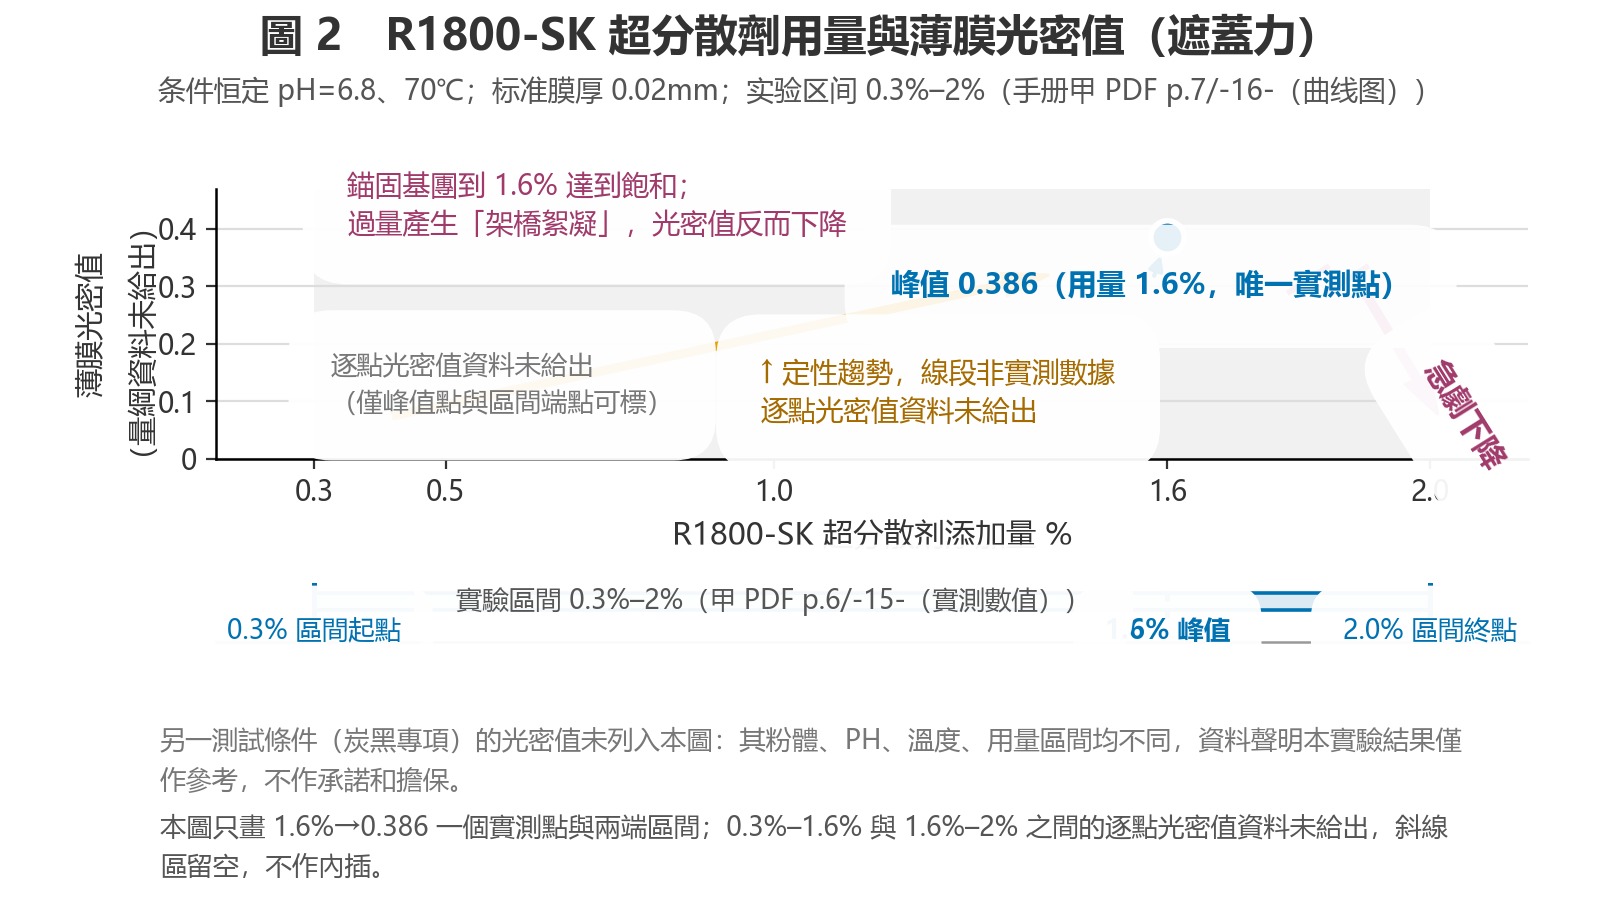
| Dosage has an upper limit; exceeding it causes a decline | "When the dosage of hyperdispersant is 1.6%, the optical density value of the film reaches its maximum at 0.386"; "As the dosage further increases, it instead decreases sharply"; "Because interactions among R1800-SK hyperdispersant produce 'bridging flocculation,' the pigment particles flocculate through entanglement of the hyperdispersant solubilization chains, causing the optical density value to decrease" | R1800-SK dedicated experimental section in both manuals |
The 3-stage process also has an important prerequisite conclusion: the manual explicitly states that "finer pigment particles readily aggregate to form large particles, affecting product quality, and therefore cannot be used directly and must undergo dispersion treatment" ("Dispersion Process" section in both the Hyperdispersant Series and Functional Additives manuals). Accordingly, the claim that "titanium dioxide can be added directly to masterbatch and used as is" is explicitly contradicted by the source material.
Core Evidence: 21 Measured Data Points for R1800-SK
The conditions were held constant at PH=6.8 and 70℃; the experimental range was 0.3%–2%. The surface-treatment formulation comprised titanium dioxide R298 (69.5g) + R1800-SK + LLDPE 218W (30g). The charging sequence was: "First, add the titanium dioxide and R1800-SK hyperdispersant to a high-speed mixer and mix until the temperature reaches approximately 100℃, then add LLDPE218W. After the materials are mixed uniformly, discharge them into a granulator for granulation and subsequent use." The experimental raw materials are identified as "R298 titanium dioxide from Pangang Group" and "LLDPE218W from Saudi Arabia" (dedicated R1800-SK experimental conditions section in both manuals; identical wording).
All 21 values in the table below are the original values in the manual. There is no calculation, interpolation, or conversion (identical table in both the Hyperdispersant Series and Functional Additives manuals). These 21 values apply only to the formulation and conditions specified in this section (PH=6.8, 70℃, experimental range 0.3%–2%). The manual does not provide comparative readings for other formulations, pH levels, or temperatures.
| Hyperdispersant dosage % | Lightness L | Tappi whiteness TW | Yellowness YI | 0% is the untreated baseline (PH=6.8, 70℃) |
|---|---|---|---|---|
| 0 | 88.27 | 75.15 | 4.63 | Baseline |
| 0.5 | 88.89 | 75.76 | 4.21 | Baseline |
| 1.0 | 89.12 | 76.31 | 4.34 | Baseline |
| 1.2 | 89.87 | 76.35 | 4.23 | Baseline |
| 1.6 | 90.18 | 77.76 | 3.84 | All 3 indicators simultaneously reach their optimum values within the experimental sequence |
| 1.8 | 88.26 | 75.81 | 3.97 | Baseline |
| 2.0 | 87.83 | 75.79 | 3.89 | Baseline |
The manual interprets the 1.6% row verbatim by stating that all 3 values "are higher than the corresponding values for untreated pigment." (The manual's original wording here carries the same evident misprint noted in §1.3 and is reproduced without alteration; the translation gives the intended meaning.)
How to Interpret the 3 Curves
First, lightness and Tappi whiteness decline synchronously after reaching their peaks at 1.6%: 90.18 → 88.26 → 87.83; 77.76 → 75.81 → 75.79. The shapes of the 2 curves are highly consistent, indicating that the whiteness performance of this group of white masterbatch samples has a monotonic relationship with a dosage ceiling for hyperdispersant, rather than a relationship in which "more is better." The provenance of these 6 readings must first be established: they come from test-panel production → colour difference meter, which is a different set of samples and a different measurement type from film blowing → transmittance in the hiding-power evaluation. The values from the 2 pathways cannot be used to infer one another, and the source text does not provide a conversion relationship.
Second, yellowness does not decline in step with the other 2 indicators: 3.84 at 1.6% is the minimum, while YI rises to 3.97 at 1.8% and then falls to 3.89 at 2.0%, still higher than 3.84 at 1.6%. In other words, after 1.6%, the "degree of yellowing" does not improve synchronously with whiteness. The 2 candidate minimum values, 3.84 at 1.6% and 3.89 at 2.0%, do not occur at the same dosage. The conditions for interpretation are correspondingly restricted: YI and TW are both obtained using a colour difference meter, but YI is a reverse indicator, and the manual does not provide the test standard number or repeatability data for YI. Whether the difference between 3.84 and 3.89 falls within the repeatability of the instrument is not provided in the source text. Accordingly, this article provides only a directional comparison and does not make a significance or compliance determination.
Third, the 3 curves no longer change synchronously after 1.6%. This is direct empirical evidence that "adding more ≠ being better in all respects." Its scope of applicability is limited to the formulation and conditions specified above, and the manual does not provide repeat experiments across formulations.
The Hiding-Power Peak and Subsequent Decline
The same experiment established the hiding-power peak: the optical density value of the film reaches its maximum of 0.386 at a dosage of 1.6% (standard film thickness of 0.02mm; constant conditions of PH=6.8 and 70℃). After the peak, it decreases sharply. The manual explains the reason directly: at an R1800-SK hyperdispersant dosage of 1.6%, the anchoring groups reach saturation. Further additions cause interactions among the hyperdispersant molecules, resulting in bridging flocculation; the pigment particles flocculate through entanglement of the hyperdispersant solubilization chains, causing the optical density value to decrease. The applicable conditions must first be stated: this value of 0.386 is the optical density value of a film (standard film thickness of 0.02mm; PH=6.8; 70℃), and belongs to a measurement system separate from the TW / L / YI readings obtained using a colour difference meter in the preceding section. "Bridging flocculation" is the mechanistic explanation provided by the manual, but this experiment presents only the increase and decrease in optical density value; the source text provides no microscopic or particle-size evidence for the flocculated structure itself.
One methodological boundary must be clarified: the manual records 2 values simultaneously. They coexist and are not subject to selection:
| Value | Basis | Manual location |
|---|---|---|
| 0.5% | Recommended process dosage (recorded alongside PH=6.8 and 70℃) | R1800-SK conventional physicochemical section in the Hyperdispersant Series manual; R1800-SK section in the Functional Additives manual |
| 1.6% | Experimental optimum dosage (maximum optical density value and minimum yellowness), experimental range 0.3%–2% | R1800-SK dedicated experimental section and dosage section in both manuals |
| 0.5%—1% | [Dosage], where the denominator is the final plastic product | Dosage section in the Hyperdispersant Series manual; "Dosage" field on the R1800-SK details page of the official website |
The recommended process value and the experimental optimum value apply to different stages. The source text does not provide a conversion relationship indicating which value should be followed, and both values must therefore be cited together.
Another point concerns the same type of boundary. The manual explicitly states regarding the experiment: "Because the testing systems and evaluation criteria of different manufacturers vary, the results of this experiment are provided for reference only. We make no promise or warranty, and users are responsible for verifying whether the results comply with their own requirements." (R101A entry in both the Hyperdispersant Series and Functional Additives manuals, on the same page as the R101A comparison table). This qualification should accompany all references to the experimental data above.
Finally, Consider the Data Themselves
The conventional physicochemical data for R1800-SK (R1800-SK section in the Hyperdispersant Series manual) are as follows: appearance, a blue paste-like material; main component, polyolefin ether (an alternative formulation, "polyolefin ether polymer," is also used, with both formulations recorded at their respective data layers); odour, "a faint lard-like odour"; amine value ≦9 mgKOH/g; density, 1.190 g/cm³; flash point, 285 ℃; viscosity, 980-3600 mPa•s (printed as mPa·s for the same item in the Functional Additives manual); acid value, 6.8-7 mgKOH/g; degree of dispersion, III (grading method not provided); packaging, 25kg in a PE plastic drum; storage, "in a cool, dry place, protected from moisture."
Another set of comparative data must be read item by item. The manual states verbatim: "The lubricating performance is 26 times that of wax, and the dispersing performance is 113 times that of wax." This is an item-by-item comparison of 2 properties, not a claim that "overall performance is 113 times that of wax". The page does not specify the test method or the reference wax type.
12 misconceptions, each with its source
Moved from the bodyOperation steps (original text, as is)
- What is measured: The transmittance of the film, converted to the optical density value at a standard film thickness of 0.02mm, termed the "optical density value" in the source text
- How the sample is prepared: Titanium dioxide pretreated with different concentrations of hyperdispersant → masterbatch production → film blowing. The process sequence in the source text is: carrier resin/pigment/hyperdispersant → high-speed mixing → granulation → extrusion film blowing → hiding power → whiteness
- Direction of interpretation: A higher optical density value = higher hiding power; the relationship is directly proportional, with no range in which "a higher value indicates poorer performance"
| # | Common claim | Source facts | Assessment | Manual location |
|---|---|---|---|---|
| 1 | "Adding a white masterbatch or liquid colour masterbatch makes the product whiter" | The R900A manual states that liquid colour masterbatch has "higher tinting strength and hiding power", that the plastic finished articles produced with it have "higher gloss", and that it "eliminates colour spots and specks on the article surface". The manual nowhere describes the product as "whiter" or as having "higher whiteness". The R900A entry contains no whiteness, lightness or yellowness values, and no optical density values | ❌ Insufficient basis; "whiter" is an inference | R900A entries in the 2 manuals; R900A details page on the official website |
| 2 | "Whitening = adding titanium dioxide = increased hiding power" | Hiding power and whiteness are determined by 2 different tests: hiding power is evaluated as the optical density of a standard film with a film thickness of 0.02mm, based on transmittance; tinting strength is evaluated using a test plate and the Tappi whiteness TW/lightness L/yellowness YI. In the R1800-SK experiment, L and TW peaked at 1.6% (90.18 / 77.76) and then decreased to 87.83 / 75.79 at 2.0%, whereas YI was 3.89 at 2.0%, higher than 3.84 at 1.6% | ❌ Invalid; the 3 curves do not move in tandem after 1.6% | "Hiding power/tinting strength" definition sections in the 2 manuals and the R1800-SK experimental table |
| 3 | "The more dispersant is added, the higher the hiding power" | The source states that hiding power "decreases sharply as the dosage is further increased". The reason given is that this causes "bridging flocculation" and therefore reduces the optical density; the anchoring groups "reach saturation at 1.6%" | ❌ Explicitly disproved; an optimum exists, beyond which the value decreases | Dedicated R1800-SK experimental sections in the 2 manuals |
| 4 | "Poor tinting strength means that the pigment itself is unsuitable, so adding a dispersant is ineffective" | The source states that the tinting strength of a pigment "depends primarily on the inherent properties of the pigment, but is also affected by pigment dispersion". After treatment with R1800-SK, the whiteness and lightness were "both higher than the corresponding values of the pigment without pretreatment" | ⚠️ Partly correct and partly incorrect: the pigment itself is the primary factor, but dispersion has a measurable effect | "Factors affecting tinting strength" sections in the 2 manuals and the interpretation of the R1800-SK experiment |
| 5 | Treating an industry colloquial expression as the formal index name used in the source materials (the colloquial term is defined in §1.4) | Searching both manuals for the colloquial term returns 0 results. The original terms used in the source materials are "dispersibility" (62 occurrences in the Hyperdispersant Series manual and 75 in the Functional Additives manual) and "degree of dispersion" (9 occurrences in the Hyperdispersant Series manual and 9 in the Functional Additives manual) | ❌ The term does not exist in the source materials; if used, it must be identified as industry jargon | Full-text search results for both manuals (see §1.4) |
| 6 | "Degree of dispersion III = dispersibility grade 3" | The "Physical and Chemical Properties" table in the manual lists "degree of dispersion: III", but the manual provides no grading method, measurement range or corresponding particle-size relationship anywhere. The R188 entry separately records "degree of dispersion: ‖" | ⚠️ The source materials do not provide the basis for assigning a grade; the symbols must not be independently interpreted | Physical and chemical properties tables for R1800-S / R1800-SK / R1800-SH / R188 in the 2 manuals |
| 7 | "R900 and R900A belong to the same product family, with the newer model replacing the older one, so purchasing the new model is sufficient" | The R900 page is titled "Composite Dispersant R900" and lists a density of 1.210g/ml, a solids content of 12.-12.7%, and states that it is discontinued. The R900A page is titled "R900A Base Material Specifically for Liquid Colour Masterbatch" and lists a density of 1.220g/cm³ with no solids content entry. "R900A is an independent model, not a suffix-coded variant of R900" | ❌ Invalid; values must not be copied between the 2 models | R900 and R900A entries in Functional Additives; R900 and R900A details pages on the official website |
| 8 | "The dispersing performance is 113 times that of wax, so the overall performance is 113 times as high" | The source states: "The lubricating performance is 26 times that of wax, and the dispersing performance is 113 times that of wax." This is an item-by-item comparison of 2 properties; the test method and reference wax type are not specified | ❌ Misreading; the source may only be cited as an item-by-item comparison | Routine physical and chemical properties section for R1800-SK in the Hyperdispersant Series; R1800-SK details page on the official website |
| 9 | "R900 has been discontinued, so R900A is its replacement" | The R900 details page on the official website states: "The official source materials do not announce a direct replacement model for this model." The only model from the same product family currently in production is provided solely "for model-selection evaluation purposes (as a reference for the same application, which does not constitute an official replacement statement)" | ❌ Insufficient basis; there is no official replacement statement | R900 details page on the official website |
| 10 | "Titanium dioxide can be added directly to the masterbatch and used as is" | The source states: "Finer pigment particles readily agglomerate, producing large particles that affect product quality. They therefore cannot be used directly and must undergo dispersion treatment." Dispersion is divided into 3 stages: wetting, size reduction (dispersion), and stabilization after size reduction (encapsulation) | ❌ Explicitly disproved | "Dispersion process" sections in the 2 manuals |
| 11 | "Once 1.6% dispersant has been added, the process is complete, and any temperature is acceptable" | The phase-transition boundary is 70℃: "Below 70℃, the coating layer does not melt; above 70℃, it begins to melt and convert into an ionic coupling agent, improving the compatibility of titanium dioxide and the resin." The conclusions separately state that "the surface-treatment effect is optimal at 70℃" | ⚠️ Temperature is an independent prerequisite, not a function of dosage alone | R1800-SK section and experimental conclusions in the Hyperdispersant Series |
| 12 | "All product parameters on the official website can be cited directly" | The R101A comparison table on the official website labels dispersibility as being on a "5-point scale", but the corresponding value is 6.50. The R900 specifications on the official website do not match the R900 entry in the manual; instead, they match the R101A table | ⚠️ The data layer contains an erroneous entry; the manual must be consulted for verification (see Sections 4 and 5) | See the following section |
Two points to note when reading data on the official website
Same-dimension range intersection (% · 3 objects)
Dimension · %X-axis = dimension %; colored band = target interval where the object can fall; points outside the band = portions that cannot be reached.
- Dosage for solid-c…
- Dosage for transpa…
- 0.2–0.5%
- Dosage field in th…
- X-axis same dimension % ·
- X-axis scale based on this article's max (0.2–40 %); do not directly compare lengths across articles.
- Dosage for solid-c…0.6–2 %
- Dosage for transpa…0.2–0.5 %
- Dosage field in th…15–40 %
Chart data (source text verbatim)
| Object | Range |
|---|---|
| Dosage for solid-colour finished articles | 0.6–2 % |
| Dosage for transparent finished articles | 0.2–0.5 % |
| Dosage field in the website data layer | 15–40 % |
Source textScale 0–44 %
These 2 points do not concern assigning responsibility; they concern how the data should be used. The data layer is the product presentation layer, whereas the manual is the technical reference layer. Where the two are inconsistent, the manual shall prevail, and the source layer being cited must be clearly identified.
4.1 The "5-point scale" and 6.50 for dispersibility are inconsistent
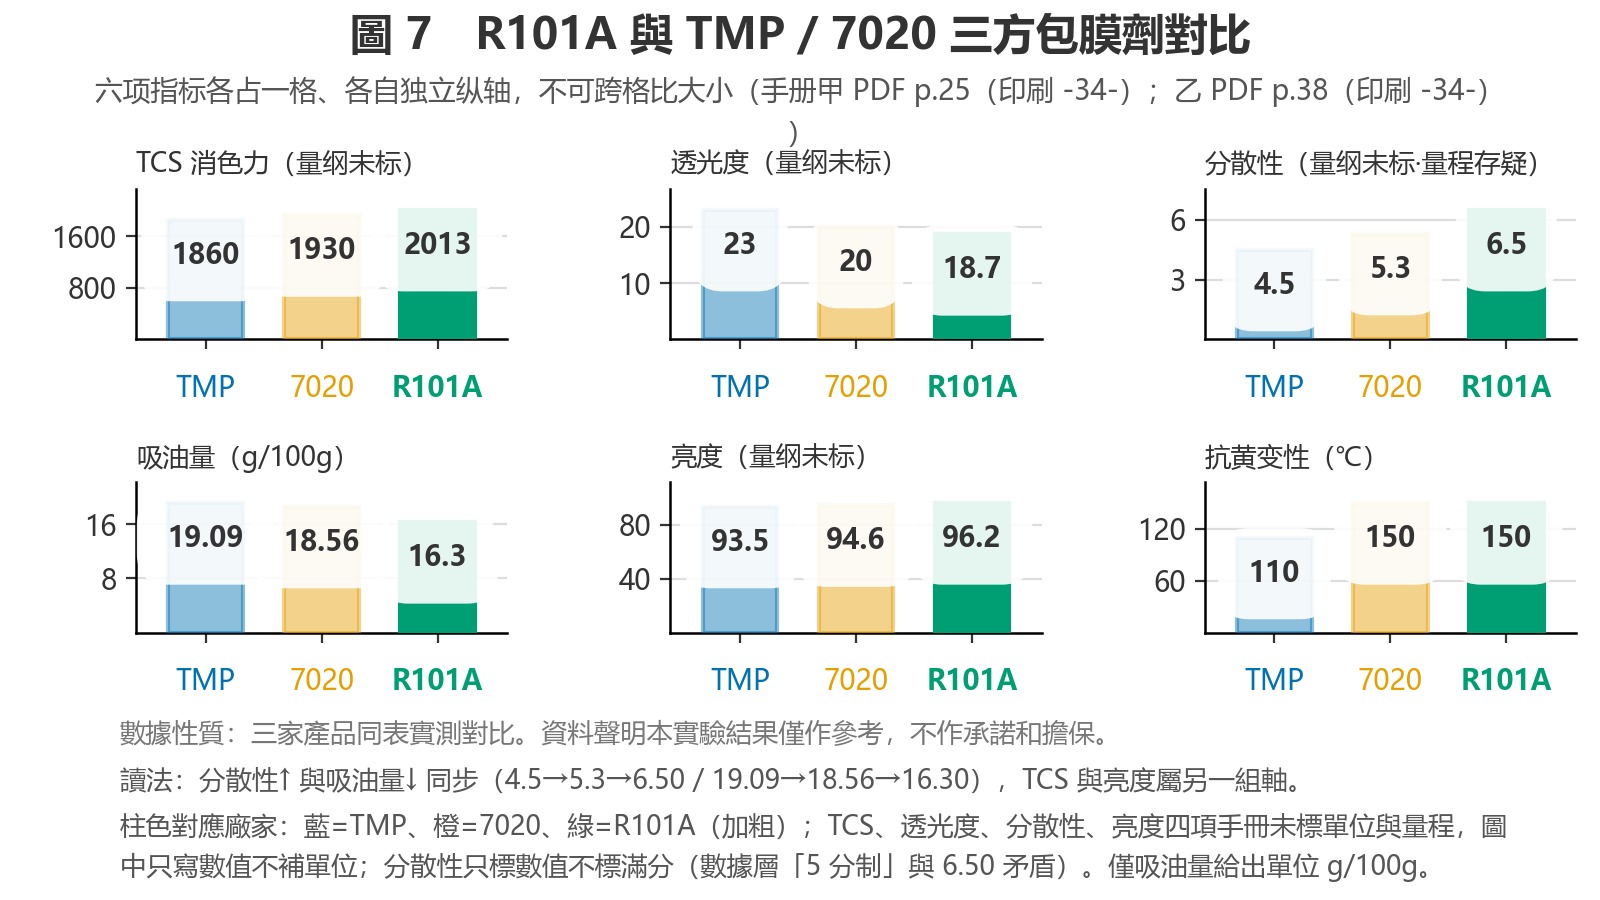
The R101A comparison table on the official website labels dispersibility as being on a "5-point scale", while the value in the same row is 6.50. This row appears in the manual in the measured comparison table for R101A, TMP and 7020, which is reproduced identically in both manuals. The source materials do not specify the test method, sample preparation or unit range for the table. Accordingly, the values may be used only for relative ranking among these 3 coating agents and must not be transcribed as absolute performance values. The same page also contains a "Special Statement", which uses the same scope of application as the experimental data in Section 2.
| Index | TMP | 7020 | R101A | Unit | Source annotation |
|---|---|---|---|---|---|
| TCS (tinting strength) | 1860 | 1930 | 2013 | Not specified in the source | — |
| Light transmittance | 23 | 20 | 18.7 | Not specified in the source | Direction: R101A is the lowest |
| Dispersibility | 4.5 | 5.3 | 6.50 | Not specified in the source | The data layer separately states a "5-point scale", which conflicts with 6.50 |
| Oil absorption value | 19.09 | 18.56 | 16.30 | g/100g | Direction: lower is better |
| Brightness | 93.5 | 94.6 | 96.2 | Not specified in the source | — |
| Yellowing resistance (loss of gloss without colour change) | 110C | 150C | 150C | ℃ | — |
The manual specifies neither the unit nor the measurement range. The "5-point scale" annotation in the data layer conflicts with the manual value of 6.50 exceeding the upper limit of 5 points; both statements must therefore be retained without selecting either one. Appropriate use: when citing this row, provide only the numerical value and note that the "unit and measurement range are not specified in the source materials". Do not write "6.50 points (maximum score: 5)".
The table should also be interpreted as follows: increased dispersibility and decreased oil absorption value move in the same direction (dispersibility: 4.5→5.3→6.50; oil absorption value: 19.09→18.56→16.30). Within the same set of 3 grades, brightness also increases monotonically (93.5→94.6→96.2). Therefore, the table itself does not constitute evidence that improved dispersion does not produce improved whiteness. The only conclusion that can be drawn is that TCS and brightness belong to another independent axis, and their trends cannot be inferred from the dispersibility column. The source materials do not provide the unit or measurement range, nor do they specify the number of repetitions or the error; accordingly, this table is for directional comparison only and must not be used to determine statistical significance or compliance.
4.2 The R900 specifications do not match the manual entry
The specifications for R900 on the official website are: appearance, white paste-like liquid / non-volatile matter, 99.9% / specific gravity, 1.03 g/mL / pH, 6.8-7 / diluent, water; and the dosage is "0.1-3% (based on powder weight)".
The R900 entry in the Functional Additives manual is reproduced verbatim below:
"Appearance: white emulsion-type liquid; density: 1.210g/ml; pH value: 6.0-7.0; solids content: 12.-12.7%; viscosity: 200-600mPas; solubility: readily soluble in water." —— Source: R900 entry in Functional Additives. R900 has been discontinued and is included solely for historical reference.
The 2 sets of values are completely different, while the former set is identical to the R101A "Key Product Indicators" table in the Hyperdispersant Series (non-volatile matter, 99.9% / specific gravity, 1.03 / pH, 6.8-7 / diluent, water / dosage, 0.1-3%). The assessment is that the data layer has apparently mistakenly assigned the R101A parameters. This conclusion is an inference drawn by comparison; neither the official website nor the manual contains a written correction. The item therefore remains to be confirmed.
The first "12" in "12.-12.7%" is followed by a decimal point, as reproduced verbatim from the manual without modification.
Appropriate use: all physical parameters for R900 must be taken from the manual, not from the data layer. The latter set of values is not to be used as the physical parameters for R900 in this article or in external content and has been added to the verification pending list.
Two additional citation rules to note
R900 has been discontinued. The header note on the R900 details page on the official website states: "R900 — Discontinued". The "Status" column in the comparison table on the R900A details page lists R900 as "Discontinued". The original text on the official website states: "This model is a historical model that has been discontinued. Its source materials have been retained; this page has been organized faithfully on the basis of the historical source materials." All R900 values in this section are for historical reference only and must not be used to recommend currently available products or imply current availability. The official website explicitly states that the official source materials do not announce a direct replacement model; therefore, R900A must not be described as its replacement. The statement in the R900 section regarding the pain points of "poor dispersion" ("The finer the powder, the more prone it is to agglomeration"…"However, the higher the amount of dispersant added, the greater the likelihood of caking during production") in the R900 entry of Functional Additives may be cited solely as mechanistic evidence, with a note that the model has been discontinued.
The 3 dosage statements for R900A use different denominators and must not be converted into one another:
| Basis | Value | Denominator | Manual location |
|---|---|---|---|
| Manual "Dosage" | 1%—10% | Final plastic product | R900A entries in the 2 manuals; R900A details page on the official website |
| Dosage for solid-colour finished articles | 0.6-2.0% | Subject = liquid colour masterbatch, not the R900A dosage | R900A entry in Functional Additives; R900A details page on the official website |
| Dosage for transparent finished articles | 0.2-0.5% | Same as above | Same as above |
| Dosage field in the website data layer | 15-40% | Relative to the liquid colour masterbatch formulation | R900A entry on the official website |
The R900A details page on the official website has registered the "correspondence between 15-40% in the data layer and 1%—10% in the manual" as verification pending item 1: the denominators differ, and the source materials do not explain their correspondence. The 3 dosage statements use different denominators and must not be converted into, calculated against, or presented as a single combined range.
Boundary between verifiable and non-verifiable information
Same-dimension range intersection (% · 2 objects)
Dimension · %X-axis = dimension %; colored band = target interval where the object can fall; points outside the band = portions that cannot be reached.
- Target band
- "The dosage can be…
- "The tinting stren…
- X-axis same dimension % ·
- X-axis scale based on this article's max (10–50 %); do not directly compare lengths across articles.
- "The dosage can be…30–50 %
- "The tinting stren…10–20 %
Chart data (source text verbatim)
| Object | Range |
|---|---|
| "The dosage can be reduced by 30%-50% during production" | 30–50 % |
| "The tinting strength of organic pigments can be increased by more than 25%, while the hiding power of inorganic pigments can also be increased" and "The tinting effect will not be weakened even if the pigment dosage is reduced by 10%~20%" | 10–20 % |
Source textScale 9–56 %
The purpose of this section is to indicate which conclusions can be checked against a supplier and which can be used only as general guidance.
5.1 Information that can be checked item by item (source text and numerical values are available)
| Conclusion | Verification source |
|---|---|
| How hiding power is measured and how the results are interpreted | "Hiding power" definition sections in the 2 manuals (definitions reproduced verbatim) |
| How tinting strength is measured and how yellowness is interpreted | "Tinting strength" definition sections in the 2 manuals (definitions reproduced verbatim) |
| The 2 approaches, qualitative and quantitative, to evaluating dispersibility | "Dispersibility" definition sections in the 2 manuals (definitions reproduced verbatim) |
| All readings at the 7 dosage points for L / TW / YI | Dedicated R1800-SK experimental table in the 2 manuals (identical wording) |
| The hiding-power peak of 0.386 at 1.6%, followed by a sharp decrease due to bridging flocculation at excessive dosages | Dedicated R1800-SK experimental sections in the 2 manuals |
| The simultaneous presence of the process recommendation of 0.5% and the experimental optimum of 1.6% | Routine physical and chemical properties section and dosage section for R1800-SK in the Hyperdispersant Series; R1800-SK section in Functional Additives |
| The 70℃ phase-transition boundary and the prerequisite of PH=6.8 | R1800-SK section and experimental conclusions in the Hyperdispersant Series; R1800-SK details page on the official website |
| The 3 stages of dispersion treatment and the statement that direct use is not possible | "Dispersion process" sections in the 2 manuals |
| Original statements concerning liquid colour masterbatch (tinting strength/hiding power/gloss/colour spots and specks) | R900A entries in the 2 manuals; R900A details page on the official website |
| Original item-by-item comparison of dispersing performance 26 times / 113 times | Routine physical and chemical properties section for R1800-SK in the Hyperdispersant Series; R1800-SK details page on the official website |
| R101A 3-way coating-agent comparison table (TMP / 7020 / R101A) | R101A comparison tables in the 2 manuals; R101A comparison table on the official website |
| Carbon black system tinting strength table (blackness 16/15, tinting strength 125%/130%) | Carbon black system comparison tables within the R101A entries in the 2 manuals |
5.2 Information that can be used only as guidance, not as a conclusion (not provided in the source materials, or conditions are not directly comparable)
| Item | Status |
|---|---|
| Point-by-point optical density values between 0.3%–1.6% and 1.6%–2% | ❌ The manual provides only the value of 0.386 at 1.6% and a curve chart. The intermediate point values are not given in the text. The chart may indicate only the peak and the ranges at both ends; intermediate values must not be fabricated by interpolation |
| Formula for converting transmittance to optical density, and model of the photoelectric spectrophotometer | ❌ Not provided in the source materials |
| Numerical scoring method for dispersibility | ❌ Only 2 approaches are provided: qualitative assessment (microscopic observation and photography) and quantitative assessment (particle-size distribution). No scoring criteria or thresholds are provided |
| Measured particle-size distribution data for dispersibility | ❌ The manual contains only A/B micrographs, with no particle-size data table |
| Grading basis for "degree of dispersion: III" and "degree of dispersion: ‖" | ❌ Only the symbols are provided; no grading criteria, measurement ranges, corresponding particle sizes or test methods are given |
| "5-point scale" annotation for dispersibility | ⚠️ Conflicts with the manual value of 6.50; see Section 4 |
| Test standard numbers for TW / L / YI | ❌ The source only states that a colour-difference meter was used and does not cite any standard, including GB/T |
| Dimensional expression for optical density | ⚠️ The manual refers to "optical density value (hereinafter referred to as optical density value)" but specifies no unit |
| Numerical dispersibility value for R1800-SK | ❌ The dedicated section provides only optical density and 3 whiteness values; no numerical dispersibility value is provided |
| Quantitative conversion relationship between hiding power and whiteness | ❌ No such relationship exists; the source materials provide no quantitative correlation between the 2 properties |
| Direct experimental data supporting "whitening → greater whiteness" | ❌ No such data exist; the manual contains no comparative whiteness experiment across formulations |
| Whiteness / hiding power / dispersibility values for R900A | ❌ No such values exist. The R900A entry contains no whiteness, lightness or yellowness values, and no optical density value; it only states qualitatively that the product has "higher tinting strength and hiding power" and "excellent dispersion performance" |
| 0.386 (SK: 0.02mm / PH 6.8 / 70℃ / 1.6%) and 0.487 (SH: 0.02mm / PH 6.2 / 80℃ / 3%, in the latter part of the R1800-SH entries in the 2 manuals) | ⚠️ The conditions differ; direct comparison of their magnitudes on the same axis or in the same chart is prohibited. When charting, the conditions must be labelled on separate lines |
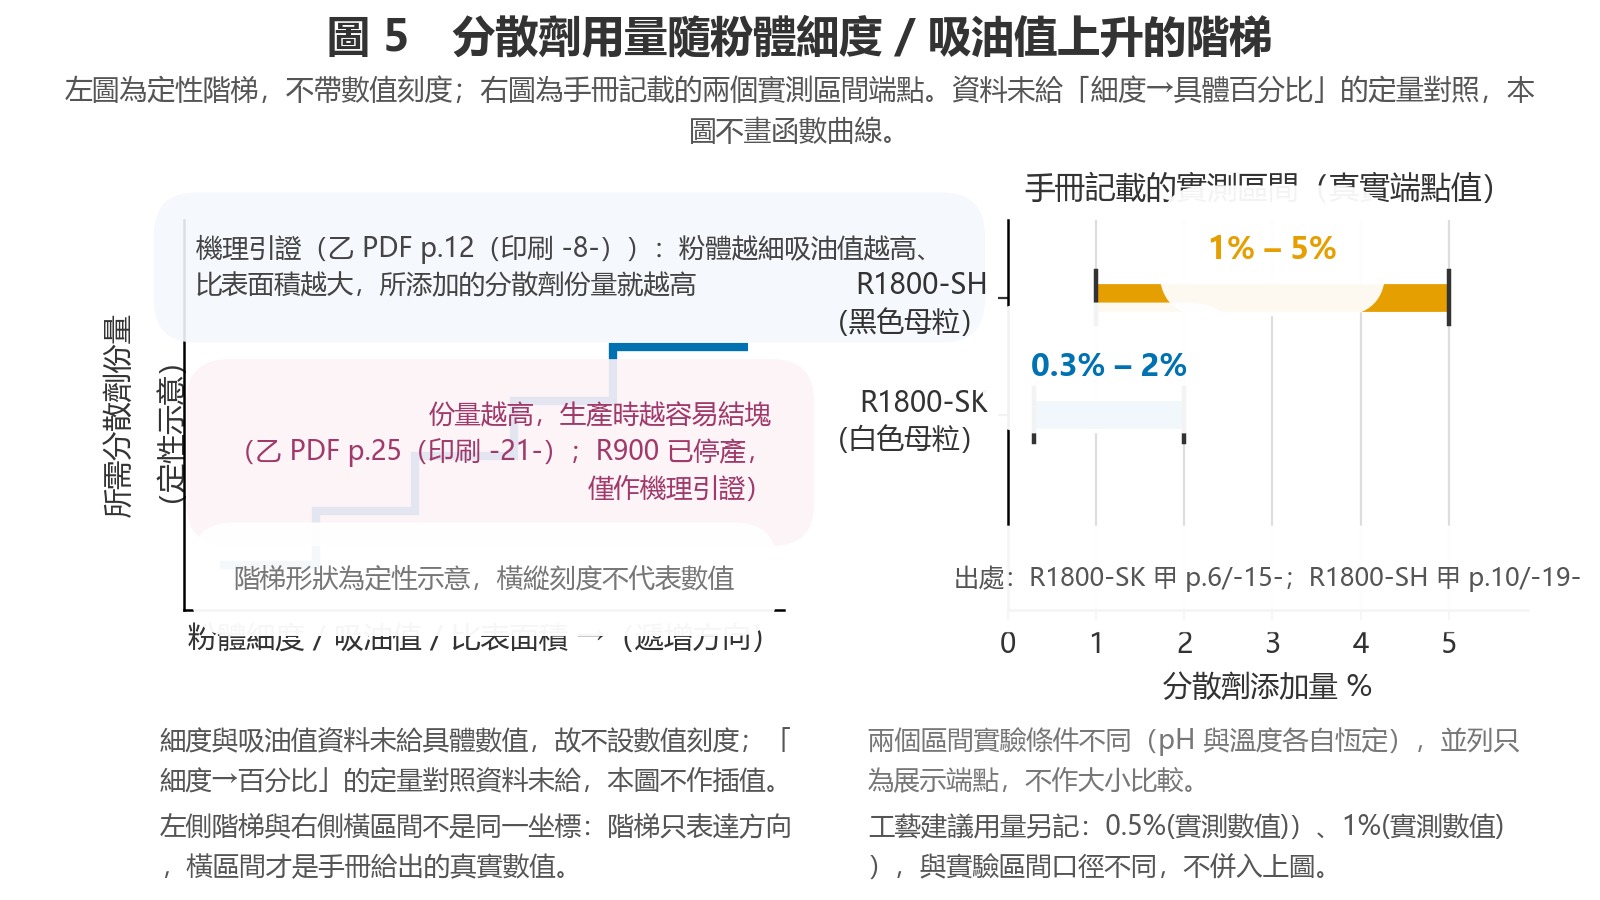
| Quantitative correspondence between "powder fineness/oil absorption value → specific dispersant dosage" | ❌ The source materials provide no quantitative correspondence. Only the mechanism statement "A finer powder generally has a higher oil absorption value and a larger specific surface area, and therefore requires a higher amount of dispersant" (Functional Additives, "Dispersant Dosage" section; identical statement on the R1800-SK details page on the official website) and 2 measured range endpoints (SK 0.3%–2%, SH 1%–5%) are available. These must not be plotted as a function curve, or used to assign a specific percentage to a particular fineness value |
| Test method and reference wax type for 26 times / 113 times | ❌ Not specified. "28 times / 122 times" are the corresponding values for R1800-SH and must not be mixed with the former values (R1800-SH section in the Hyperdispersant Series) |
| "The dosage can be reduced by 30%-50% during production" | ⚠️ Company statement (R1800-S section in Functional Additives); the source materials do not provide the test basis or applicable conditions |
| "The tinting strength of organic pigments can be increased by more than 25%, while the hiding power of inorganic pigments can also be increased" and "The tinting effect will not be weakened even if the pigment dosage is reduced by 10%~20%" | ⚠️ Company statement; it must be qualified with the R1800-S model (R1800-S entry in Functional Additives) |
| Third-party test report numbers for all models | ❌ Not attached to the source materials (similar articles on the official website already state: "No third-party test report is attached to this page") |
| Shelf life, MSDS-level data, and compliance certification statements such as RoHS/REACH for each model | ❌ Not provided in the source materials |
| Test conditions and inspection method for the R900A claim of "heat resistance at 80-280℃" | ❌ Not provided (R900A entries in the 2 manuals; noted on the R900A details page on the official website) |
| Solids content entry for R900A | ❌ This model has no such entry; applying a value from an adjacent model is prohibited |
| Halogen content statement for R900A | ❌ The R900A details page on the official website explicitly states: "No statement is made regarding halogen content" |
Use boundaries for the data in this article
- This article contains no pricing, customer names, certification numbers or performance guarantees.
- All cited experimental data are accompanied by the following statement in the manual: "Because the testing systems and evaluation criteria of different manufacturers vary, the results of this experiment are for reference only. We make no commitments or warranties, and users are responsible for verifying whether the product meets their own requirements."
- Sentences marked [Company Statement] represent the company's position and are not part of the source text.
- Numerical values, codes and units are reproduced at the same source layer, without conversion, changes in precision or standardization of notation.
Figure Descriptions

The following 8 figures use only the actual data listed in this article. This article does not generate any images.
[Figure 1] 3 separate routes for the 3 indicators — Data-point list: hiding power = pretreated titanium dioxide (TiO₂) → masterbatch preparation → blown film → transmittance measurement → conversion to optical density at the standard film thickness of 0.02mm (the “Hiding Power” definition section in both manuals); tinting strength = pretreated pigment → white masterbatch preparation → sample panel preparation → colour difference meter measurement of TW/L/YI (same section); dispersibility = observation and photography using a phase-contrast microscope or electron microscope (qualitative) / particle-size distribution (quantitative) (same section); processing performance = torque rheometry (same section); process-flow chain = carrier resin/pigment/hyperdispersant → high-speed mixing → granulation → extrusion film blowing → hiding power → whiteness (same section) — Recommended figure type: process matrix diagram (3 parallel branches, indicating the different sample-preparation methods and interpretation directions; the yellowness branch should be separately marked as “reverse”). No new data are required.
the anchoring groups become saturated at 1.6%
[Figure 3] 3-line comparison of lightness / Tappi whiteness / yellowness (main figure of this article) — Data-point list: 7 dosage points × 3 indicators = 21 values, copied item by item: 0% → 88.27 / 75.15 / 4.63; 0.5% → 88.89 / 75.76 / 4.21; 1.0% → 89.12 / 76.31 / 4.34; 1.2% → 89.87 / 76.35 / 4.23; 1.6% → 90.18 / 77.76 / 3.84; 1.8% → 88.26 / 75.81 / 3.97; 2.0% → 87.83 / 75.79 / 3.89 (R1800-SK dedicated experimental tables in the two manuals) — Recommended figure type: 3-line chart, with yellowness on an inverted secondary axis (lower is better), and a vertical reference line at 1.6%. The key observation is that L and TW decline simultaneously after 1.6%, while yellowness at 2.0% remains higher than at 1.6%. This is the only curve chart in the full list for which all 21 points can be checked one by one without any calculation. Prioritise this figure.
finer pigment particles readily coagulate…cannot be used directly and must undergo dispersion treatment
R1800-SK…is mainly used for white masterbatches for plastics and rubber
units as stated in the source text; unspecified units must not be added.
plastic masterbatches are convenient to use…with uniform and stable colouring
Source List
The sources cited in this article consist of 3 documents: 2 official manuals and 1 layer of official website data.
| # | Source | Section(s) of this article in which it is used |
|---|---|---|
| 1 | Hyperdispersant Series (hyperdispersant manual) | Misconception 6 (degree of dispersion III) |
| 2 | Hyperdispersant Series | Section 2 (R1800-SK physical and chemical properties, 0.5% recommended process value, 70℃ phase transition, three-stage theory, “cannot be used directly”), Misconceptions 8 and 11 |
| 3 | Hyperdispersant Series | Section 1 (verbatim definitions of the 3 indicators, influencing factors, process-flow chain, experimental formulation), Misconception 2 |
| 4 | Hyperdispersant Series | Section 2 (21-reading table, 0.386 peak, bridging flocculation, A/B micrograph comparison), Misconceptions 2, 3 and 4 |
| 5 | Hyperdispersant Series | Section 2 (1.6% experimental optimum, 0.5%—1% addition level, 70℃ conclusion) |
| 6 | Hyperdispersant Series | Section 2 (SH comparison), Misconceptions 6 and 8 (28-fold / 122-fold) |
| 7 | Hyperdispersant Series | Section 1 (carbon black tinting strength definition), Section 5 (0.487 conditions) |
| 8 | Hyperdispersant Series | Misconception 1 (R900A liquid colour masterbatch statement) |
| 9 | Hyperdispersant Series | Section 5 (R900A addition level 1%—10%), Misconception 1 |
| 10 | Hyperdispersant Series | Section 2 (experimental statement), Figure 7 (R101A comparison table) |
| 11 | Hyperdispersant Series | Section 4 (R101A [Main Product Indicators] table), Figure 7 |
| 12 | Hyperdispersant Series | Section 1 (R188 degree of dispersion ‖) |
| 13 | Hyperdispersant Series | Section 1 (aqueous dispersion algorithm and worked example) |
| 14 | Functional Additives (functional additive manual) | Section 5 (30%-50% company statement) |
| 15 | Functional Additives | Figure 8 (colour masterbatch statement) |
| 16 | Functional Additives | Section 5 (the finer the powder, the greater the amount of dispersant required) |
| 17 | Functional Additives | Section 5 (above 25%, 10%~20%, company statement) |
| 18 | Functional Additives | Sections 1 and 2 (definitions of the 3 indicators, 21-reading table, verbatim consistent with Hyperdispersant Series) |
| 19 | Functional Additives | Section 1 (carbon black tinting strength) |
| 20 | Functional Additives | Section 4 (R900 entry, bridging mechanism), Misconceptions 7 and 9 |
| 21 | Functional Additives | Misconception 1, Section 5 (R900A dosage statement) |
| 22 | Functional Additives | Section 2 (experimental statement), Figure 7 |
| 23 | Functional Additives | Section 5 (carbon black tinting strength table) |
| 24 | Official website data layer: product master table | Section 4 (contradiction in the R101A comparison table concerning the “5-point scale,” suspected erroneous association of R900 specs), PH=6.8 premise |
| 25 | Official website detail page: R1800-SK | Sections 1, 2, 4 and 5 (0.386 field, 0.5%—1% addition level, 70℃ phase transition, 26-fold / 113-fold, statement that finer powder requires more dispersant) |
| 26 | Official website detail page: R900A | Sections 1, 2, 4 and 5 (original liquid colour masterbatch statement, dosage statement, 15-40% to be verified, heat-resistance entry, missing solid-content item, halogen statement, standalone-model statement, status column) |
| 27 | Official website detail page: R900 | Section 4 (discontinued status, poor dispersion mechanism, no directly announced replacement model, registration of suspected erroneous specs association) |
| 28 | Official website page for related articles | Section 5 (third-party test report not attached) |
not provided in the source text
mPa•s (Hyperdispersant Series) and mPa·s (Functional Additives) coexist and are reproduced at their respective source layers. Items not recorded in the manuals must be stated as “not provided in the source text”; no assumptions, gap-filling or drafting on behalf of the source is permitted.Article actions
If this piece was useful, you can leave a mark — the like count comes from our back office at admin.kj9896.com; when the endpoint is unreachable the buttons are disabled and the count shows “—”. No invented figures are ever filled in.
Link: https://kj9896.com/en/news/covering-tinting-dispersion
Related reading
- 01Hyperdispersant and Wetting-Type Dispersant: Division of Roles in Plastics Colouring and Four Operational Guidelines1 October 2026
- 02Three Action Points of Hyperdispersants in Colour Masterbatch: Preventing Agglomeration, Distribution Rate and Lubrication Balance25 September 2026
- 03R1800-SK and R900A for flame-retardant dispersion without affecting flame retardancy12 October 2026
Products mentioned in this article
- R1800-SKR1800-SK Hyperdispersant R1800-SK
- R1800-SR1800-S Hyperdispersant R1800-S
- R1800-SHR1800-SH Hyperdispersant R1800-SH
- R900R900 Hyperdispersant R900
- E099E099 Hyperdispersant E099
- R900AR900A Liquid Color Masterbatch Base R900A
- R101AR101A Inorganic Powder Coating R101A
- R188R188 Water-based Coating Dispersant R188
- RPEG20RPEG20 Organic Coating Agent RPEG20
- R6800R6800 Biodegradable Compatibilizer R6800
Keep reading
More company announcements and product updates are in the newsroom.