
Technology explained · 4 October 2026
Melt Viscosity Goes Up: Which Figures Can Be Compared, and Which Are Not Stated in the Documentation
After a flame retardant is incorporated into a formulation, the melt viscosity rises, and the number of figures available for comparison is limited. This article reviews the official product documentation point by point: none of the systems provides an absolute melt viscosity value. R200 shows only a relative reduction of 15-20%, and this figure is strictly tied to a “60% filler system” and a “PP matrix”. R915 provides 2 sets of coexisting processing temperatures and 1 low-shear screw instruction. All cases involving non-comparable dimensions are identified individually.
- 01Anti-agglomeration
- 02Distribution rate
- 03Lubrication balance
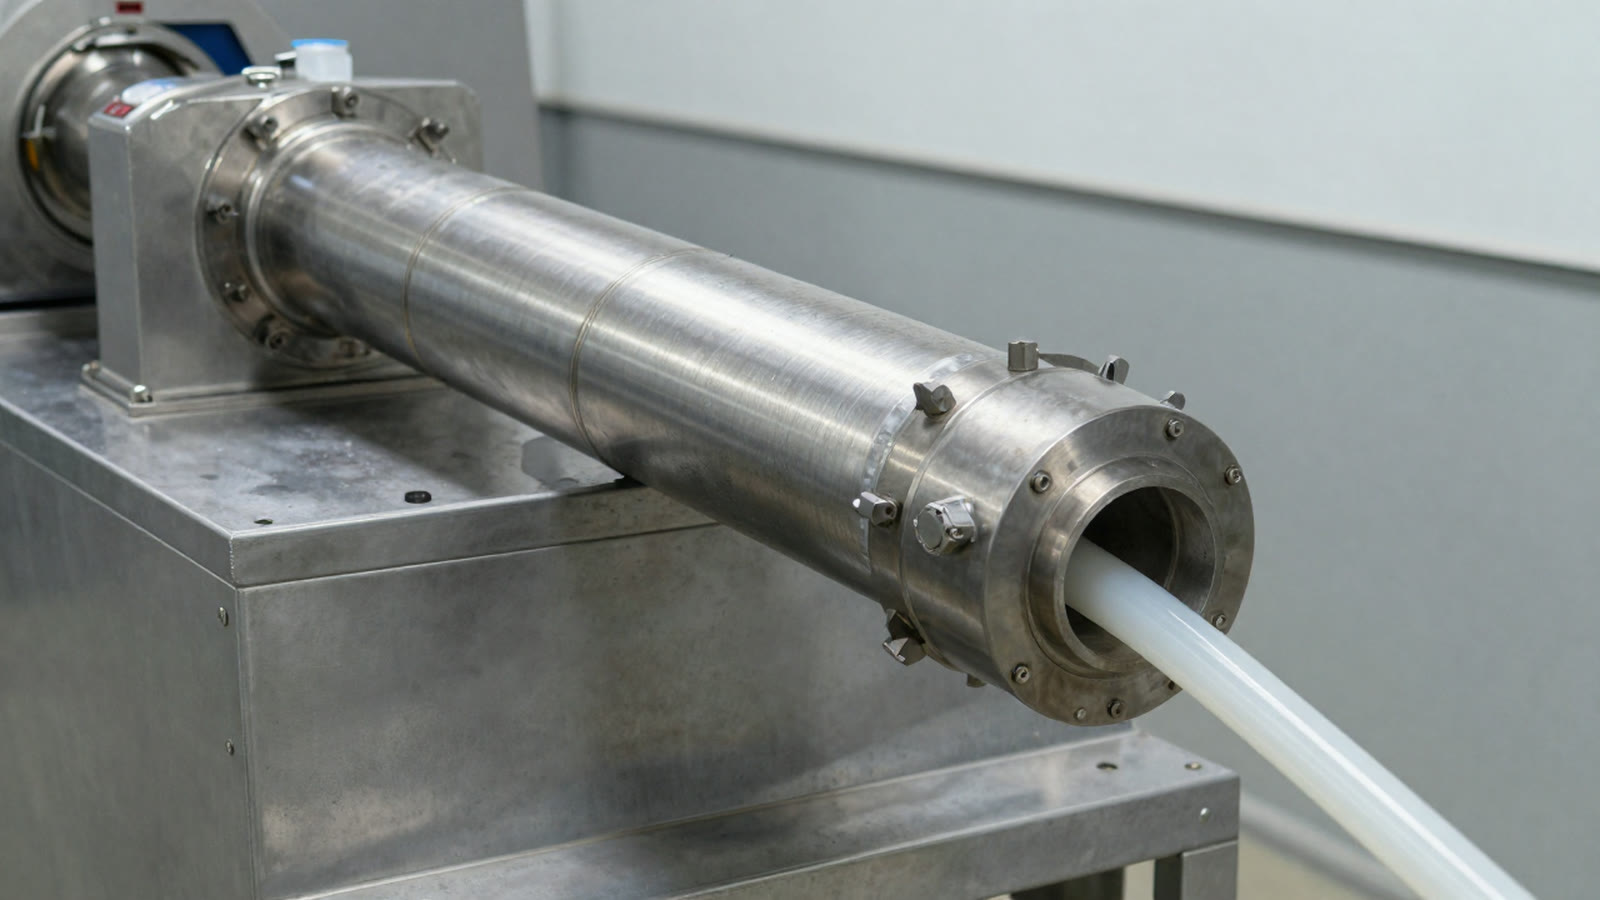
Moved from the bodyFirst data table in this article (as quoted)
| Item | Specification parameter | Effect on flame retardant efficiency |
|---|---|---|
| Active ingredient content | ≥98% | High purity maximizes coupling and dispersion efficiency |
| Heat resistance | Stable performance above 200℃ | Forms a temperature-gradient synergy with the decomposition temperature of hydroxide (300-450℃) |
| Interfacial tension reduction | ≥40%(with PP matrix) | Improves flame retardant wettability and reduces flame retardant dead zones caused by agglomeration |
| Melt viscosity reduction | 15-20%(60% filler system) | Allows higher filler loading(up to 60%), with a 20% increase in flame retardant dosage permitted |
| PH value | 7.5-8.0 | (blank in the source text) |
| Appearance | Yellow viscous liquid | (blank in the source text) |
Subtitle: High-loading magnesium hydroxide and transparent polyester flame retardants: 2 approaches to the processing window, and 1 clue that must be followed up with the supplier
After a flame retardant is incorporated into a formulation, the first processing issue is always the flow behaviour: has the material become more difficult to plasticize, has the pressure increased, and have gel spots begun to appear in the particles? In engineering, this is referred to as an increase in viscosity. The statement itself is not wrong; the issue is “by how much.”
First, 2 terminological points should be clarified. First, this article uses the term “viscosity” as it appears in the documentation, although the term refers to different indicators in different specification tables, including a relative reduction, melt flow, and the viscosity of the product itself. Since the source text does not provide a unified definition, each reference below is tied back to its specific measurement dimension. Second, the term “the entire database” refers only to the additive and masterbatch volumes used in this article, including publicly available product data from the official website. Other Californium Curium product lines, unpublished internal testing, and subsequent versions are outside the scope of this article. No assertions are made where the official documentation does not provide the relevant information.
After reviewing additive and masterbatch documentation covering more than 10 models across magnesium hydroxide, aluminium hydroxide, PET/PETG polyol phosphate ester, and PP/PE masterbatch applications, the conclusion may surprise many technical engineers: no system in the entire database provides an absolute melt viscosity value (Pa·s). Not a single one.
This is not an omitted figure in the documentation. It is precisely the first question that should be raised with the supplier during product selection.
not stated in the documentation
Starting with gel spots: this is not a matter of guesswork; the source text contains the relevant description
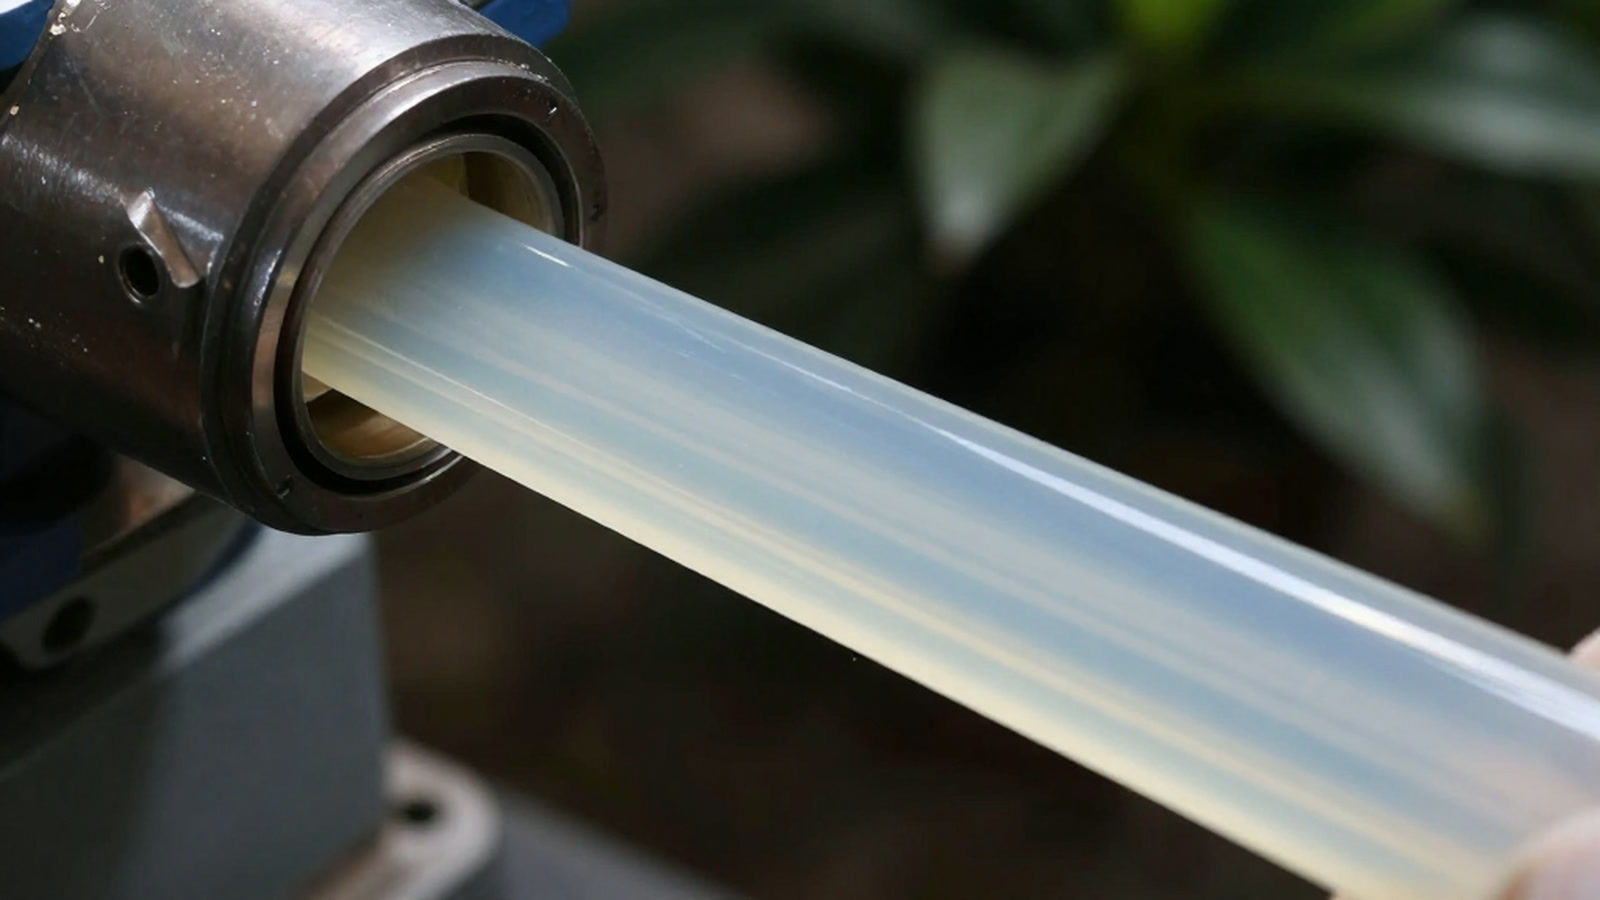
First, consider the observed phenomenon. A common complaint during the processing of high-loading hydroxide systems is that bright spots appear on the product surface, the cross-section has a granular appearance, and the pellets vary in size. The industry refers to this as gel spotting. This description of the phenomenon represents industry common knowledge: the source text does not provide the criteria, test method, or quantitative threshold for determining gel spots. It can generally be used only as an entry point for identifying the phenomenon, and not as an acceptance criterion.
The documentation provides the following complete qualitative description of this process:
“As the filler loading increases, plasticization slows down, melt strength decreases, melt pressure declines, and the powder in the melt becomes difficult to disperse, resulting in gel spots.”
Please note the level of precision in this statement: it identifies 4 stages in the causal chain—slower plasticization, reduced melt strength, lower melt pressure, and insufficient powder dispersion. However, it provides not a single numerical value. There is no Pa·s, MPa, rpm, or melt pressure. The “4 stages” are a segmentation introduced in this article for ease of reading. The source document does not present the statement in separate items, and a different segmentation would naturally result in a different number of stages. This is an editorial judgement, not a statement made by the documentation.
Nevertheless, this description is not without value. The same document identifies the objectives that a dispersant is intended to address—improving the dispersion of fillers in plastics, reducing gel spots, and improving the flow performance of the material in the screw—as well as 4 consequences of an imbalance between internal and external lubrication:
The same section also describes the control logic for melt temperature. The source text states: “If the melt temperature is too low, plasticization will be insufficient and dispersion incomplete... If the melt temperature is too high, on the one hand, the material will be over-plasticized and the melt strength will be low; on the other hand, difficulties may arise in pelletizing, strand formation, and other operations.”
increase in viscosity
quantitative value not stated in the documentation
The only hard figure for a “viscosity reduction”: it is relative and strictly tied to specified conditions
Melt viscosity reduction formulation hierarchy
Dimension · %Each segment's width = proportion of that component, totaling exactly 100%; segment color shading = hierarchy (main agent / auxiliary agent / carrier).
- cosity reduction 15-
- Synergist · 20%
- her filler loading(up …
- Main · 60%
- Synergist · 20%
- Fig. Melt viscosity reduction formulation hierarchy
- Total 100.0% — Classification by share: Main ≥25% · Synergist 8~25% · Additive <8%
- cosity reduction 1…20 %
- her filler loading…60 %
- with a20 %
Chart data (source text verbatim)
| Component | Share |
|---|---|
| cosity reduction 15- | 20% |
| her filler loading(up to | 60% |
| with a | 20% |
Technical data sheet for modelScale 0–100 %
With regard to melt viscosity itself, the documentation contains only 1 hard numerical value. It appears in the specification table for R200, a coupling-type hyperdispersant:
This figure has 4 conditions that must be stated together. Omitting any 1 of them would make the statement misleading:
- The conditions are stated in parentheses. The source text only provides “60% filler system” and “with PP matrix”. The measurement temperature, measurement method, matrix grade, and equipment used are not stated in the documentation. As a result, this figure is not reproducible for technical exchanges and can only be used as a directional reference.
- The associated data are also conditional. The “with PP matrix” condition also applies to the ≥40% interfacial tension reduction. Removing these words would leave a numerical value without a defined basis.
- It appears only in the R200 specification table. It should not be treated as a common characteristic of the entire additive range. The source text does not provide retest data for this reduction in other models, nor does it provide the number of tests, sampling method, or statistical basis. It is 1 recorded value, not a distribution.
The same volume of the Hyperdispersant Series repeats this entry verbatim, which provides mutually corroborating information; however, it is still the same data point, not a second data point.
Regarding torque, the documentation does mention 1 method: “Processing rheological performance is one of the important indicators for the application of titanium dioxide (TiO₂) in plastics. The torque rheometer method may be used to evaluate the processing performance of titanium dioxide (TiO₂) in plastics.” (Hyperdispersant Series, 2 locations covering titanium dioxide (TiO₂) and carbon black). However, this is a methodological statement, and neither location is a record relating to R200 (the subject in the source text is the application of titanium dioxide (TiO₂)/carbon black; extending this to the other product categories in the documentation goes beyond the scope of the original statement, and this article does not make that extension); the specific numerical value for torque rheometry is not stated in the documentation.
The 15-20% figure applies to a “60% filler system”: the denominator is more important to follow up than the value itself
Moved from the bodyOperation steps (original text, as is)
- It is a reduction, not a viscosity value. The source documentation does not provide the baseline value for “15-20%”. It cannot be used to calculate the absolute melt viscosity of any system, nor can it provide any multiple.
The figure in Section 2 contains 1 easily overlooked qualifier: “60% filler system.” It fixes a relative reduction at a specific loading level—and the method for determining the loading level is itself a matter of definition. The source documentation does not provide the measurement basis for the percentage in parentheses, nor does it provide any conversion or explanation for the same volume in its other sections. This article follows the source text and does not supply a definition on its own.
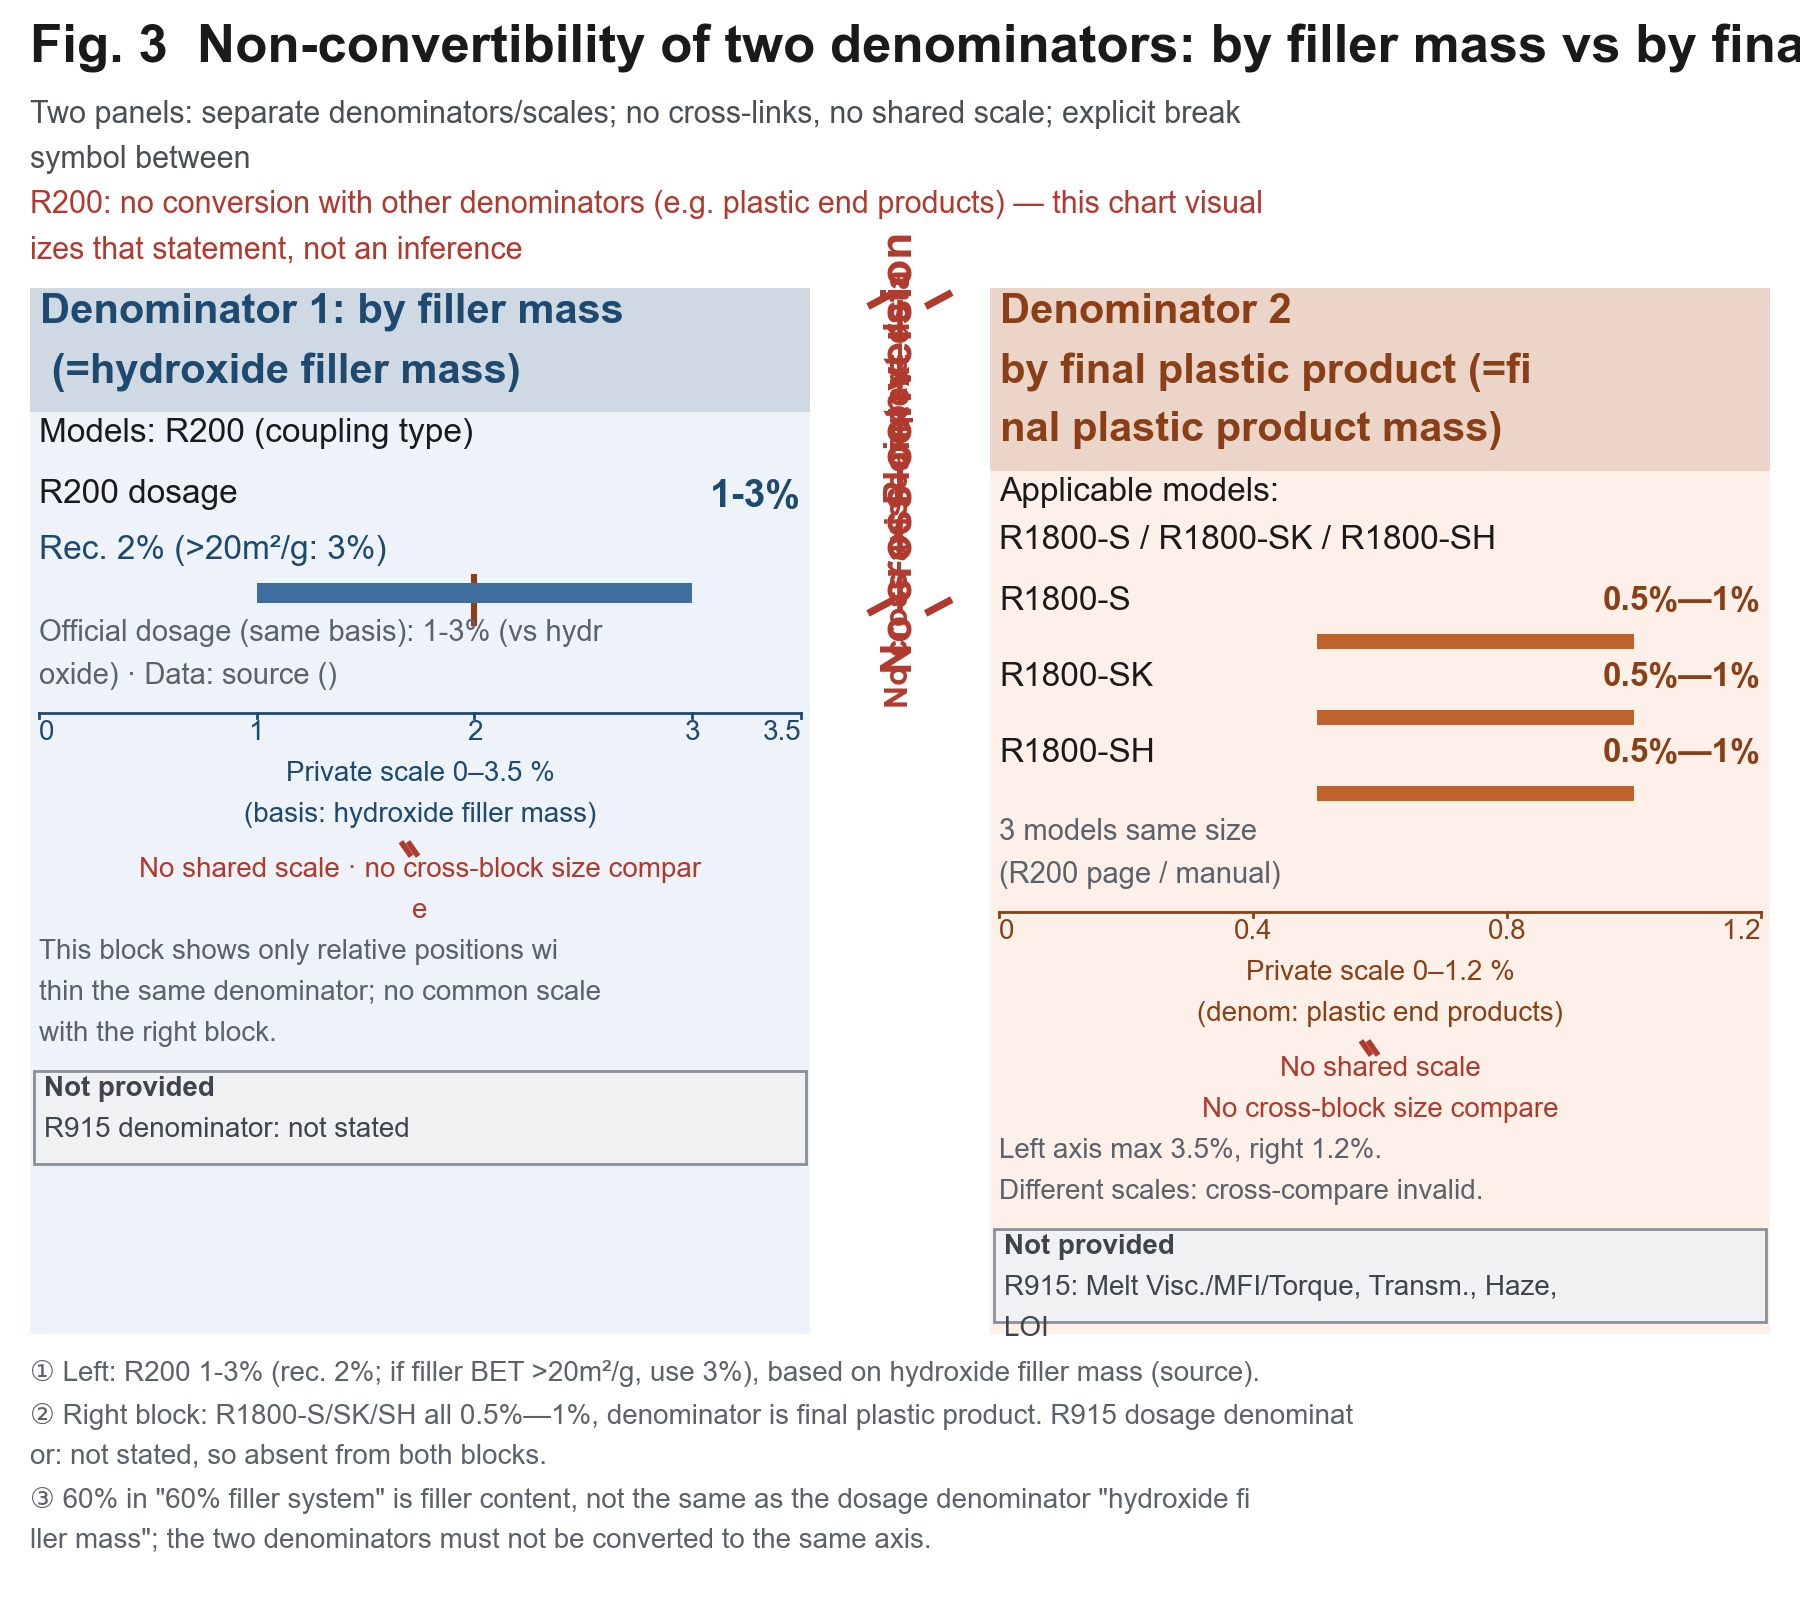
The dosage denominator for R200 is clearly stated in the manual: 1-3% based on the mass of the hydroxide filler, with 2% recommended(when the filler specific surface area is >20m²/g, increasing the dosage to 3% is recommended). The official product page uses the same basis: 1-3% (relative to the hydroxide).
However, in the comparison section of the same documentation, R1800-S / SK / SH use a different denominator: 0.5%—1% based on the final plastic product, with the same basis applying to all 3 grades (official R200 page / official product data).
not interchangeable with denominators such as ‘final plastic product’
⚠️ Denominator note (for background only, not expanded here): a comprehensive discussion of denominators belongs to the dosage topic and is not developed in this article. Only 1 point needs to be remembered here—the 60% in “60% filler system” is the filler loading; it is not the same quantity as R200’s dosage denominator, namely “the mass of the hydroxide filler.” When reading “15-20%”, its parenthetical conditions must be read together with the value.
There is another issue involving 2 coexisting statements that must be reproduced as written. The upper limit for R200 filler loading is presented in 2 ways in the same documentation:
Explicitly stated in the documentation: not interchangeable.
1-3%(2% recommended); R1800-S/SK/SH on the final plastic product denominator side 0.5%—1% — Recommended chart type: 2 side-by-side coloured blocks, with only the model data points for that denominator shown in each block, no connecting line between the blocks, and no unified scale; insert an explicit break symbol between the blocks and label it “Explicitly stated in the documentation: not interchangeable.”Two approaches: one changes the interface, while the other changes the equipment and formulation
To address the deterioration in flow behaviour caused by fillers, the documentation presents 2 paths with fundamentally different characteristics.
4.1 Path 1: coupling-type hyperdispersant(active viscosity reduction; all items are quoted from the manual)
The approach in this branch rebuilds the interface between the filler and the matrix, breaks up agglomerates, and restores the flow behaviour. The complete process described in the documentation is as follows:
- Interface
- organophosphorus groups form covalent bonds with the hydroxide surface; interfacial tension reduction ≥40%(with PP matrix)→ improves wettability and reduces flame retardant dead zones caused by agglomeration
- Flow
- melt viscosity reduction of 15-20%(60% filler system)→ allows higher filler loading(up to 60%); the “60% filler system” in parentheses is a condition included in the source text of this documentation; without it, the figure is not valid
- Particle size
- agglomerated particles are dispersed into nanoscale units(average particle size decreases from 5μm to below 1μm), increasing the contact area between the flame retardant and the matrix by more than 3 times
- Preprocessing
- the product and hydroxide are pretreated at a ratio of 1:50 in a high-speed mixer at 1200rpm for 15 minutes, enabling a filler surface coating rate of over 95% and improving dispersant dispersion uniformity by 40%
- Dual modification
- 3% silane coupling agent may be used in combination during filler preprocessing to form “organophosphorus-silane” dual interfacial modification
- Temperature control: blend the PP matrix at 180-200℃ and avoid high temperatures(>220℃)that may cause decomposition of the organophosphorus components and affect the synergistic flame retardant effect
- Temperature-zone synergy(combustion side, not processing side): stable performance above 200℃ + endothermic dehydration of hydroxide at 300-450℃ → forms a temperature-gradient synergy; phosphorus-char layer temperature zone: 200-300℃
These points can be used as directions for product selection, but should not be used as acceptance criteria. The test methods, statistical basis, and number of samples for interfacial tension, particle size, coating rate, and uniformity improvement are not stated in the source text. The temperature ranges are stated for the PP matrix; the corresponding ranges for alternative matrices are not stated.
Please note the status of the 1200rpm value above: it is the high-speed mixer speed during the preprocessing step, not the screw speed. This is the only rpm value in the entire article, and it is precisely the point that many technical engineers may mistake for evidence that “the documentation provides a rotational speed.”
Regarding the effect of screw speed on dispersion, the documentation contains only 1 directional statement(🟡 level, recorded for R1800-S, not R200): “With traditional formulations, increasing the screw speed improves production efficiency, but the dispersion of colour often deteriorates. With the use of the R1800-S hyperdispersant... the dispersion effect does not merely avoid deteriorating, but may sometimes improve substantially.” No rotational-speed value is provided. (For clarity, the 🟡 level marker is an editorial designation introduced in this article and is not part of the source documentation; the source text does not provide a grading standard. The record also does not provide the test formulation or speed range, and therefore cannot generally be used to back-calculate an in-house screw-speed setting.)
viscosity reduction → torque reduction → energy reduction → equipment life extension,
4.2 Path 2: dosage reduction / equipment replacement / formulation modification(manual text and industry common knowledge must be distinguished)
This branch addresses transparent polyester(PET/PETG)systems. Since the dosage is inherently low, the approach is not to reduce the viscosity back to its original level, but to maintain the processing window. The following points are taken from the manual text:
- Equipment(the only qualitative instruction): use a low-shear screw dedicated to polyester to avoid a reduction in light transmittance caused by excessive shear
- Feed form
- rapidly blend R915 with PET/PETG pellets for 5–8min, then feed the material to the machine after uniform mixing
- Masterbatch route
- a 20%–30% concentration PET/PETG flame retardant masterbatch may be prepared first
- Dosage reduction
- a small amount of phosphorus-nitrogen synergist may be added as required to reduce the dosage without affecting transparency throughout the process(the graded dosages are assigned elsewhere and are not repeated here; note that the denominator is not stated in the documentation, and neither the mass relative to the resin mass nor the total mass of the system is specified)
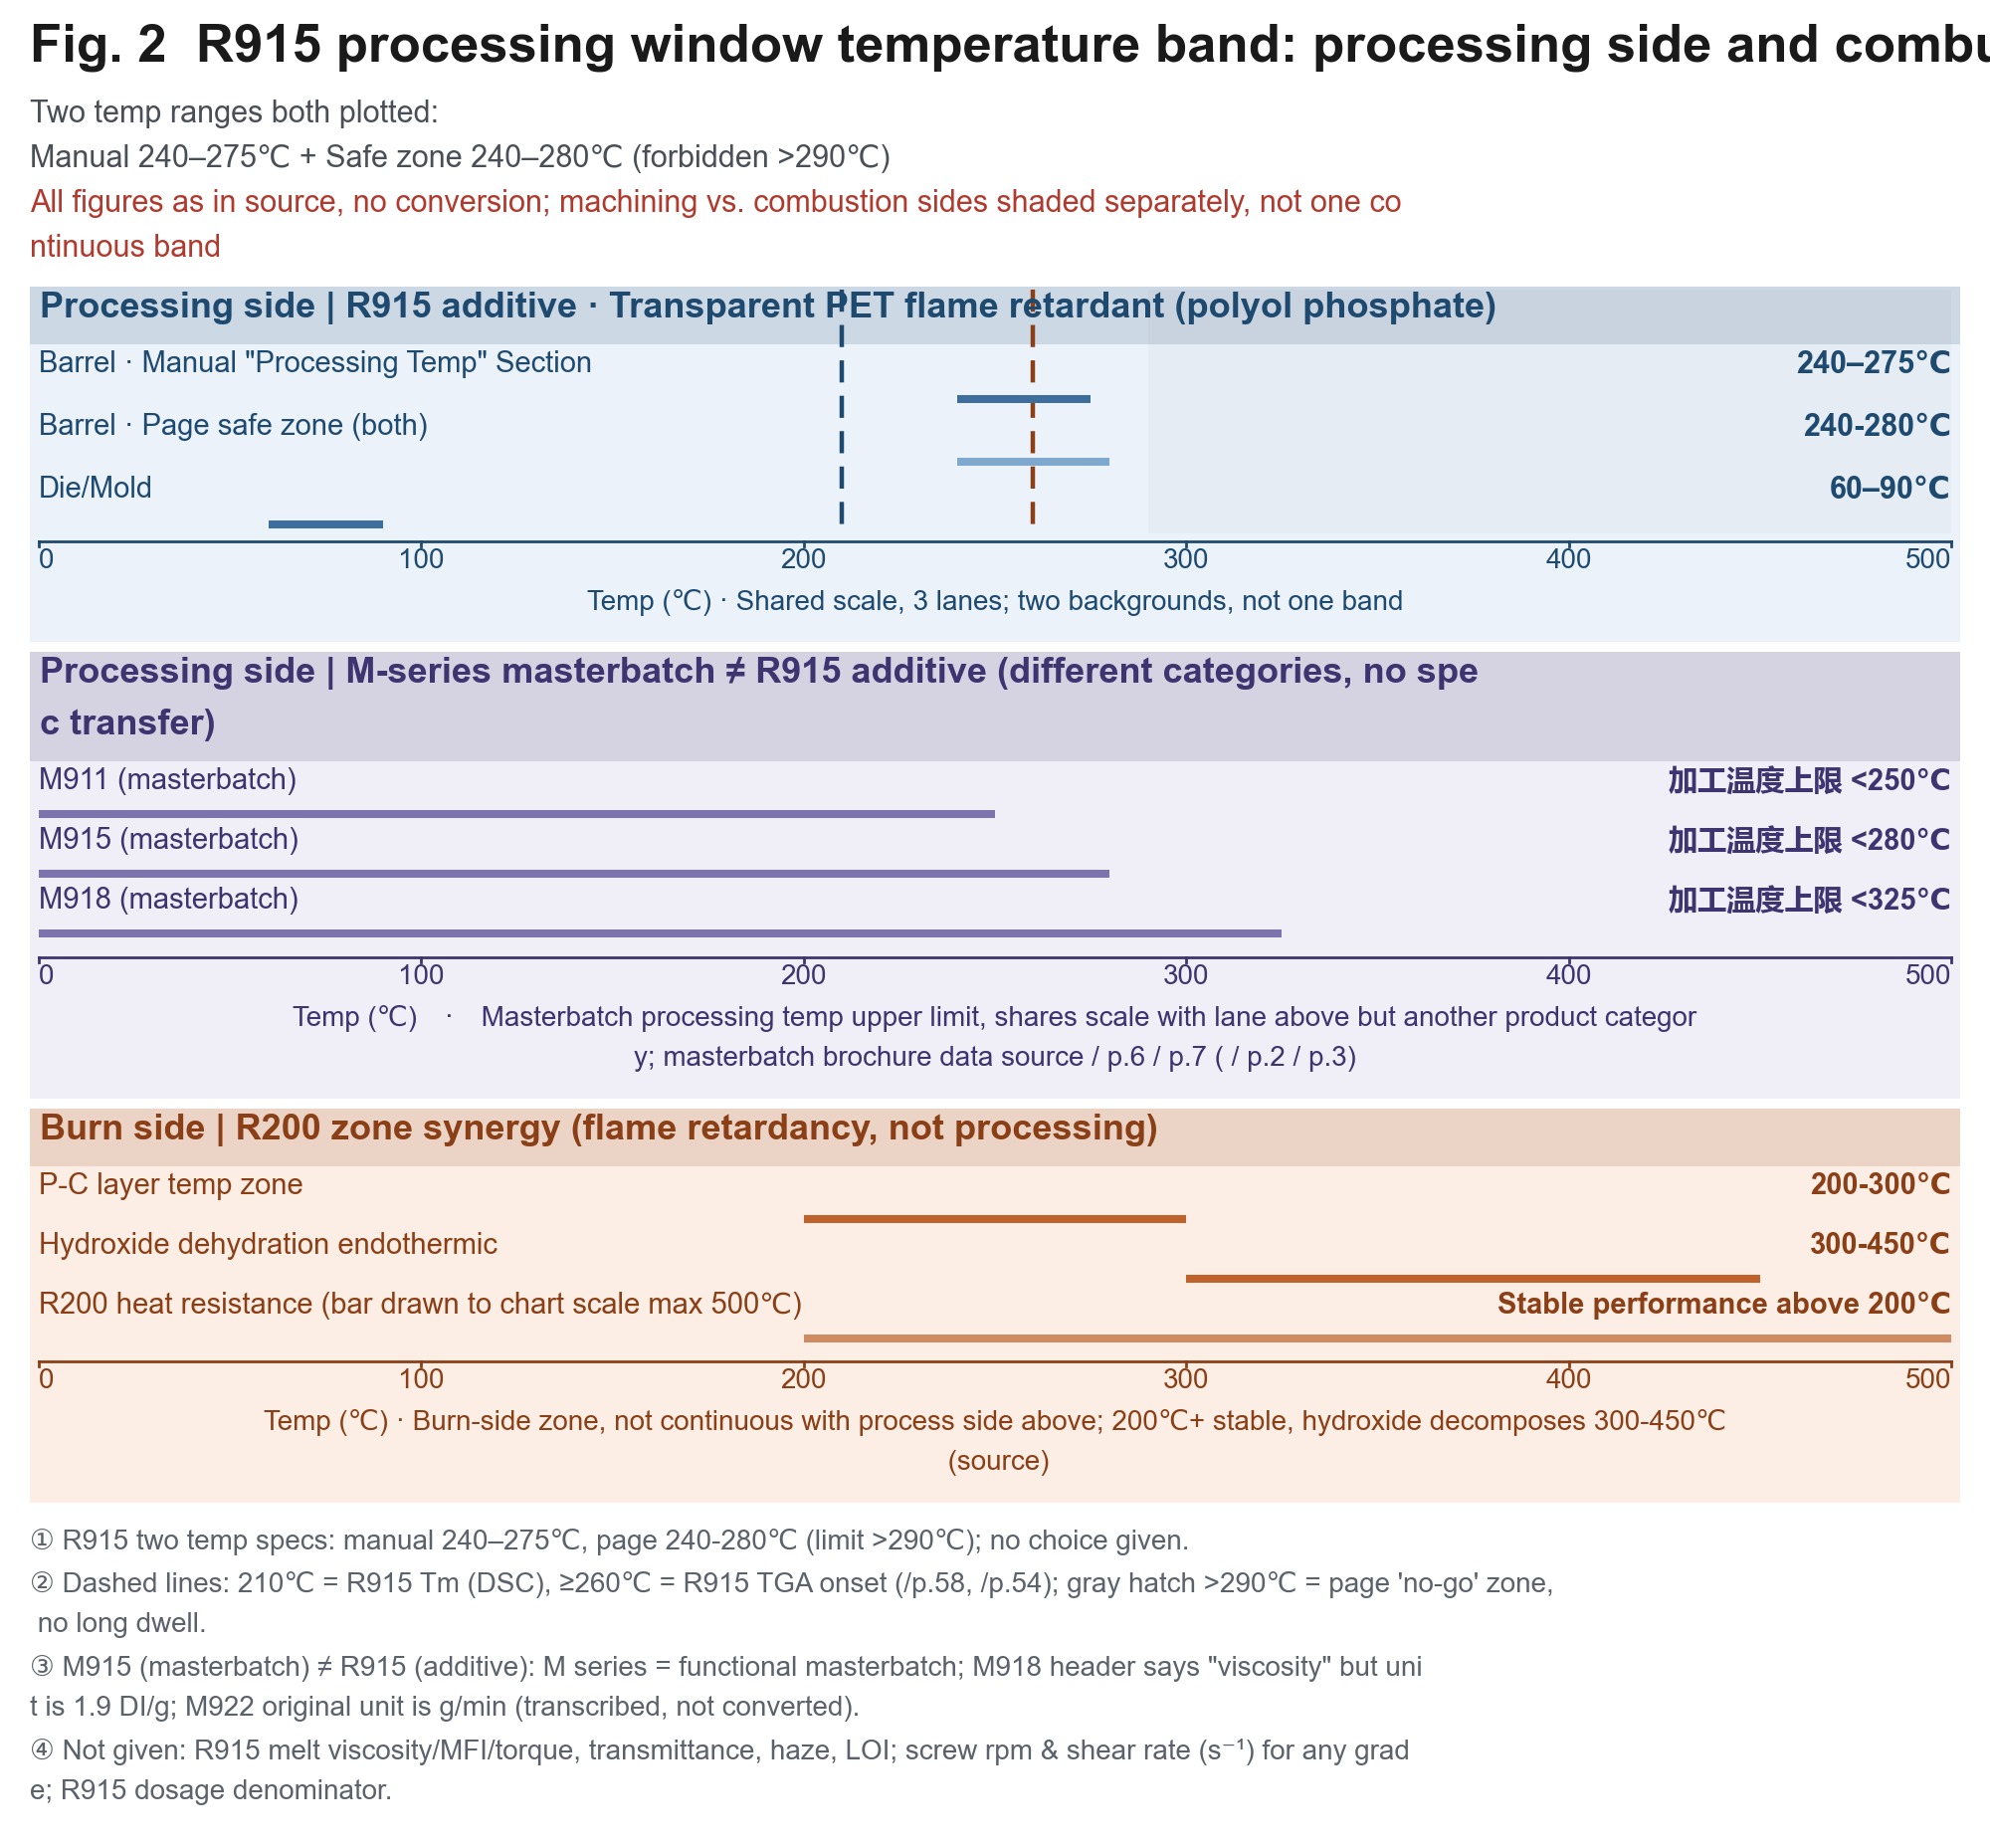
- Temperature-control zones: extruder/injection moulding barrel: 240–275℃; die/mould: 60–90℃; prolonged residence above 290℃ is prohibited to avoid slight thermal degradation of the flame retardant and the resulting yellowing
- Hydrolysis control
- dry the PET/PETG substrate at 120℃ for 4–6h in advance, with moisture ≤0.03%, to prevent whitening caused by hydrolytic degradation during processing
- Compatibility
- fully compatible with PET and PETG, with no impact on transparency(test standard: light transmittance testing of extruded specimens)
no impact on transparency throughout the process
⚠️ There are 2 coexisting sets of processing temperatures for R915: the manual’s “Processing temperature parameters” section states 240–275℃, while the page’s safe processing range states 240-280℃(prohibited zone >290℃). Both statements are given in the source text, and neither is selected here. The basis for judgement lies in the difference between the page-level and manual-level descriptions. Before use, confirm with the supplier which set applies to the version in hand.
The following points are industry common knowledge / author additions for which the documentation provides no numerical values. They may be used only as a list of questions, not as a basis for citation(🔵 level; 🔵 and 🟡 are editorial designations introduced in this article, and the source text does not provide a grading standard. These points also have no specific literature citations and should be treated as empirical reminders):
- After reducing the dosage, the flame retardant rating must be revalidated—the dosage-reduction paths in the manual are all premised on achieving the rating; omitting validation transfers the risk to the customer
- Equipment replacement(including a change in screw configuration or machine platform)constitutes a change in manufacturing capability; its effects on rheology and appearance must be verified by in-house testing, and another company’s curves cannot simply be copied
- When changing equipment suppliers, specifying “the processing window of this formulation on your machine” in the technical agreement is less costly than assigning responsibility after the fact
4.3 Common prerequisites for both routes
In the section entitled [Comprehensive Customer Service], the source text identifies 4 main process parameters: temperature, screw speed, die pressure, and pelletization.
All 4 are identified, but none of the 4 is given a numerical value. At the equipment level, this document provides parameter names and qualitative descriptions; the official documentation does not provide ranges, and no values will be added here. The source text likewise addresses equipment differences only qualitatively. It states: “The plasticizing capacity and dispersive mixing capacity of extruder screws produced by different equipment manufacturers are different. For example, the plasticizing capacities of twin-screw and single-screw pelletizers differ substantially.” This acknowledges the differences but provides no comparison data.
This is the actual situation addressed in today’s article: the source text helps with qualitative characterization, not quantification.[Figure 2] R915 processing-window temperature bands (separated into processing-side and combustion-side zones) — Data-point list: Processing side — R915 barrel: 240–275℃; page safety zone: 240-280℃; prohibited from remaining at >290℃; die: 60–90℃; melting point: 210℃; onset of thermal decomposition: ≥260℃; M911 upper limit: <250℃, M915 upper limit: <280℃, M918 upper limit: <325℃ (Functional Masterbatch Manual); combustion side — R200 phosphorus-char layer: 200-300℃, hydroxide dehydration: 300-450℃ — Recommended chart format: horizontal temperature axis, with the processing zone and flame-retardancy mechanism zone separated by 2 background colours and clearly labelled by zone name (it is strictly prohibited to connect them into a single band with the same background colour). Show both temperature specifications for R915 simultaneously as parallel lines, without selecting either one.
The most important point for the equipment side: a dedicated low-shear polyester screw
Among all the preceding information, if only 1 point can be retained for the equipment side, it should be this statement concerning R915:
“Screw selection: select a dedicated low-shear polyester screw to avoid a reduction in light transmittance caused by excessive shear.”
does not provide data
The engineering implications of this statement must be explained clearly:
- Dispersion has two sides. In transparent polyester systems, breaking up powder involves a risk of excessive dispersion: the more intensive the dispersion, the more molecular chains are severed, affecting light transmittance and haze. This is industry knowledge: the source text does not provide a quantitative relationship between molecular-chain shear and light transmittance or haze. The manual provides only the qualitative statement “avoid a reduction in light transmittance caused by excessive shear.” Transparent components and filled components have opposite dispersion requirements: the former requires less shear, whereas the latter requires more shear. This is precisely why the term “low shear” is included in the manual.
- It is directly related to the temperature window. A low-shear screw reduces the shear load on the screw side, allowing the barrel temperature window of 240–275℃ / 240-280℃ to be maintained. If the temperature cannot be controlled, slight thermal degradation and yellowing of the flame retardant will occur. Equipment selection and temperature setting cannot be adjusted separately.
- A reference sample is also included in the source text. The entry for R912B states: “It is recommended to control the processing temperature at 230℃-280℃ (20-30℃ lower than the conventional PET processing temperature) to avoid a reduction in PET viscosity at high temperatures, which would make processing and fibre spinning difficult” (R912B entry). This statement is also qualitative: no numerical value is provided for the “reduction in PET viscosity.” It belongs to another product line and does not provide the same basis as R915. The source text does not provide its test conditions, so it is not used here as supporting evidence for R915.
The boundaries of this instruction must be defined precisely, otherwise it will be treated as an executable procurement specification:
| What “low shear” specifically refers to | Source-text status |
|---|---|
| L/D ratio | Not provided in the source text |
| Screw configuration / combination recommendation | Not provided in the source text |
| Shear level / shear rate (s⁻¹) | Not provided in the source text |
| Screw speed (rpm) | Not provided in the source text |
| Quantitative relationship between shear rate and haze/light transmittance | Not provided in the source text (only the qualitative statement “avoid a reduction in light transmittance caused by excessive shear”) |
| Metering / pumping method for liquid additive (R200) | Not provided in the source text (as stated on the official R200 page) |
Therefore, this statement should be used to formulate questions, not to prepare a procurement specification. After receiving it, 3 questions should be asked of the supplier: Which configuration does “low shear” refer to? What is the corresponding L/D ratio? Within what speed range is the shear rate kept below the threshold? The source text provides no answer to the third question; technical support from the supplier will therefore be required.
Our technical personnel visit the customer’s production site to provide the most suitable process parameters.
Framework table: 5 separate measurement bases; the 5 groups are not directly comparable
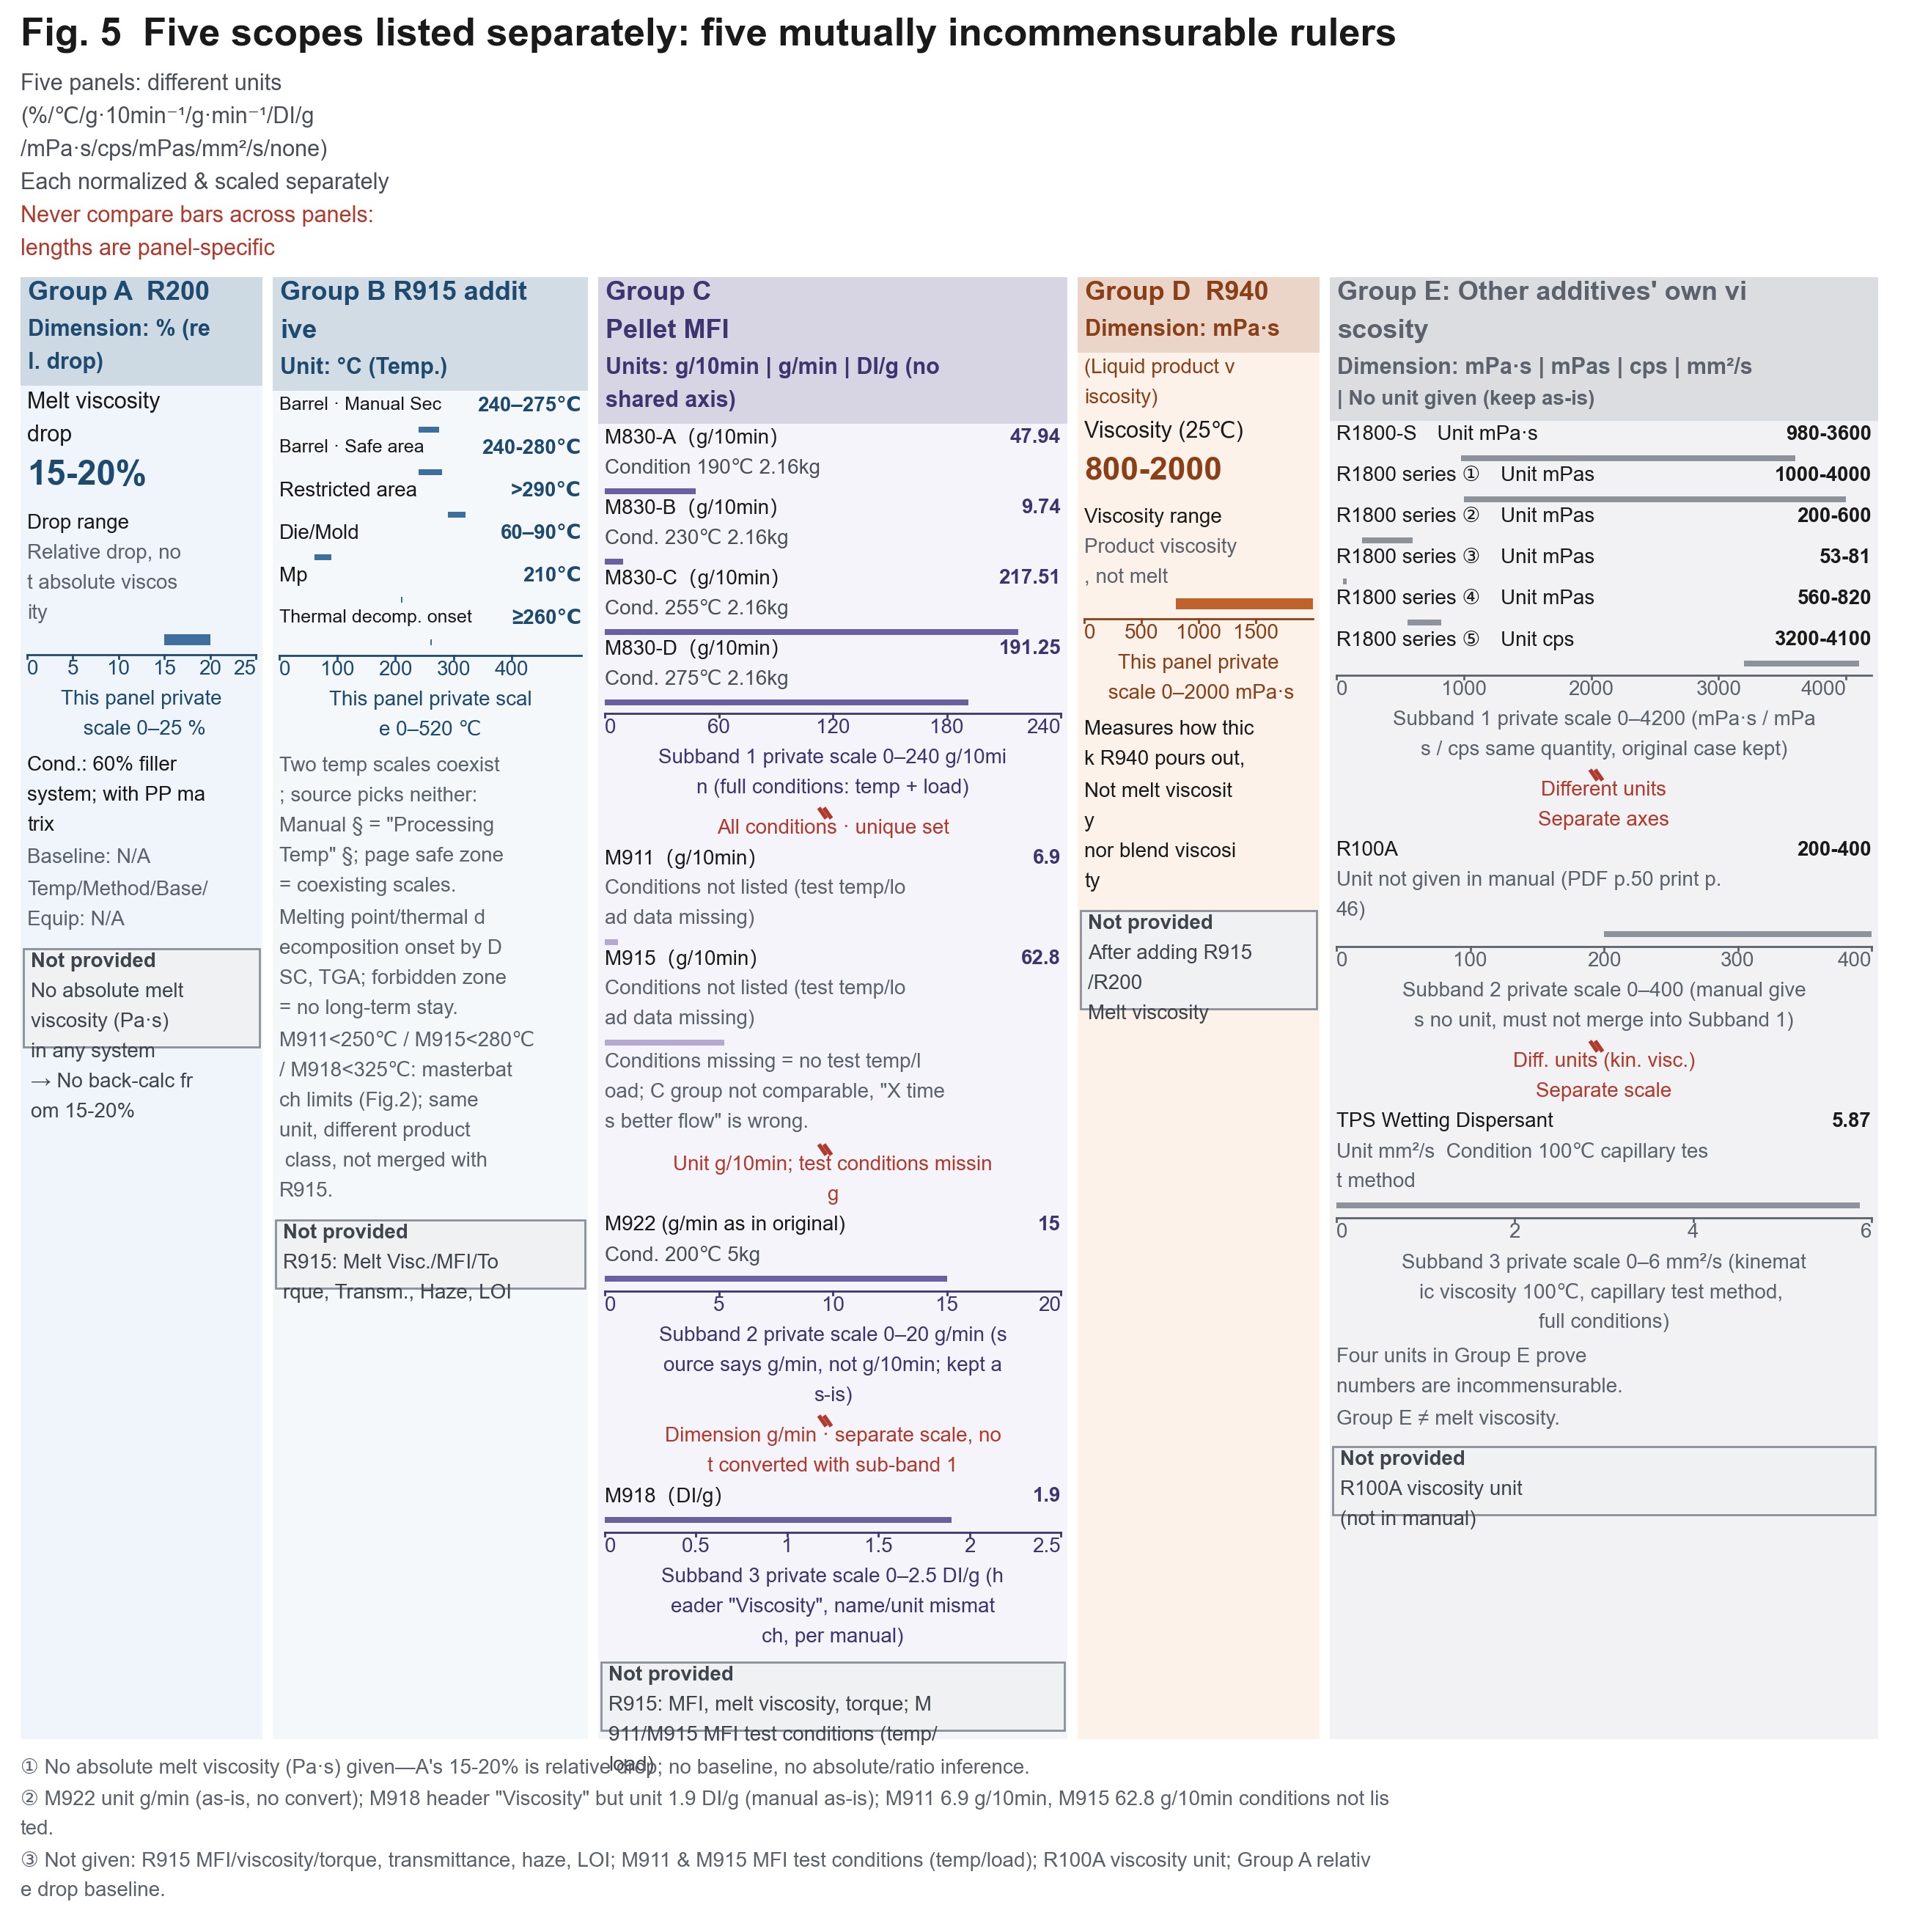
This section requires careful reading. The following table consolidates relevant data scattered across the technical-data tables for different models, but its organizational logic must first be understood: the 5 groups are not 5 points on a single curve; they are 5 non-interchangeable measurement standards.
| Group | Model | Indicator | Value | Unit of measurement | Basis and conditions |
|---|---|---|---|---|---|
| A | R200 | Reduction in melt viscosity | 15-20% | % (relative reduction) | 60% filler system; with a PP matrix; measurement temperature/method/grade/equipment not provided |
| B | R915 | Extrusion/injection barrel temperature | 240–275℃ | ℃ (temperature) | Manual, “Processing Temperature Parameters” section |
| B | R915 | Page-designated safe processing zone | 240-280℃ (prohibited zone >290℃) | ℃ (temperature) | 2 sets of specifications coexist with the preceding row; neither is selected |
| B | R915 | Die/mould temperature | 60–90℃ | ℃ (temperature) | Same as above |
| B | R915 | Melting point / onset of thermal decomposition | 210℃ / ≥260℃ | ℃ | DSC / TGA |
| C | M911 | Melt flow index MFI | 6.9 | g/10min (flow) | ⚠️ Test conditions (temperature/load) are not listed in the source text |
| C | M915 | Melt flow index MFI | 62.8 | g/10min (flow) | ⚠️ Test conditions are not listed in the source text |
| C | M918 | Header states “viscosity” | 1.9 | DI/g | ⚠️ The indicator name and unit do not match; the manual states them as such (DI is the customary unit for relative viscosity in PA6, but the source text provides no explanation); processing temperature upper limit <325℃ |
| C | M922 | Melt flow index MFI | 15 | g/min (unit in the source text) | ⚠️ The source text states g/min rather than g/10min; the original unit is retained and no conversion is made; conditions: 200℃5kg; decomposition temperature: 230℃ (TGA 1%), melting point ≥160℃, density 1.10 g/cm³ |
| C | M830 series | Melt flow index MFI | A 47.94 / B 9.74 / C 217.51 / D 191.25 | g/10min (flow) | ✅ The only group in the entire database with all conditions specified: A (190℃, 2.16kg) / B (230℃, 2.16kg) / C (255℃, 2.16kg) / D (275℃, 2.16kg) |
| D | R940 | Viscosity (25℃) | 800-2000 | mPa·s (liquid product itself) | This is the viscosity of the liquid additive itself, not the melt viscosity and not the viscosity of the system after addition; flash point (closed cup) >120℃; acid value ≤15 mgKOH/g; total phosphorus approximately 10.5% |
| E | R1800-S | Viscosity | 980-3600 | mPa·s (product itself) | Official product data |
| E | R1800 series | Viscosity | 1000-4000 | mPa·s (product itself) | Official product data |
| E | R1800 series | Viscosity | 200-600 | mPas (product itself) | Same as above |
| E | R1800 series | Viscosity | 53-81 | mPas (product itself) | Same as above |
| E | R1800 series | Viscosity | 560-820 | mpas (product itself) | Same as above (the official source text uses lowercase letters without a separator; retained as written) |
| E | R1800 series (another grade) | Viscosity | 3200-4100 | cps (product itself) | Official product data |
| E | R100A | Viscosity | 200-400 | (Unit not provided in the manual) | Official product data |
| E | Q90 hydrophilic rubber/plastic additive | Viscosity | 1000-2800 | mpa.s (lowercase in the source text) | Product itself, 25℃ |
| E | TPS wetting-type dispersant | Kinematic viscosity (100℃) | 5.87 | mm²/s | Capillary test method; conditions fully specified |
3 discontinuities that must be understood immediately
how much it decreased
15-20% is a relative reduction (the condition in parentheses, “60% filler system,” comes from the source text; removing it would alter the meaning), whereas 6.9/62.8 are melt flow rates. One indicates “how much it decreased”; the other indicates “how fast it flows.” The 15-20% value cannot be discussed together with any MFI value.Discontinuity 2: Group C cannot be compared internally either. M911’s 6.9 g/10min and M915’s 62.8 g/10min are both provided without test conditions. The source text places them in the same manual as the M830 series, for which the conditions are fully specified, making it easy to compare their values intuitively. Only the following statement can be made (directional only, not quantitative): qualitatively, M915 is more prone to flow. It is incorrect to state that its flowability is X times better—because the conditions differ, the ratio is meaningless. The correct form for a reference group is that used for M830: state both temperature and load (47.94 @190℃/2.16kg). Until the conditions are added, the 2 entries for M911 and M915 may only be used as records of their existence. The official source text does not provide their test conditions; no inference or estimation will be made, and M830’s conditions will not be substituted.R940 reduces the melt viscosity
800-2000 mPa·s indicates how viscous the liquid additive itself is when poured out. It measures the R940 product, not how viscous the melt becomes after R940 is added. Describing this as “R940 reduces the melt viscosity” confuses 2 different things. Group E simultaneously contains 6 forms: mPa·s, mPas, mpas, cps, mm²/s, and “unit not provided in the manual.” This is itself evidence that these values are not interchangeable. (DI/g is not included in this list—it is the unit used for Group C M918 and cannot be discussed together with Group E; moreover, cps is written in lowercase in the source text.)🧯 M915 (masterbatch) ≠ R915 (additive)—a single-letter difference, and the most error-prone point in the entire article. M915 = PETG flame retardant masterbatch in the Functional Masterbatch Manual, with a melt flow index of62.8 g/10min(conditions not listed), an addition rate of 6%-10%, a processing temperature upper limit of <280℃, and a specific gravity of 1.21 g/cm³. R915 = transparent polyester flame retardant (polyol phosphate ester) in the official flame retardant documentation, with a melting point of 210℃, phosphorus content of 18%, moisture content ≤0.2%, fineness of 325 mesh ≥98%, halogen not detected (IEC 61249-2-21), barrel temperature of 240–275℃, and premixing time of 5–8min. The 2 are different product categories (masterbatch / additive), not 2 names for the same product.The MFI, absolute melt viscosity, numerical values for light transmittance and haze, and LOI value for R915 are all not provided in the source text—anyone using M915’s62.8to substantiate R915 is fabricating data.
Measurement bases are not comparable; horizontal conversion is prohibited.
15-20% (60% filler system); Group B: R915 240–275℃ and 240-280℃ (coexisting), 60–90℃, 210℃, ≥260℃; Group C: M911 6.9/M915 62.8 (g/10min, conditions not listed), M918 1.9 DI/g, M922 15 (g/min, 200℃5kg), M830 A/B/C/D 47.94/9.74/217.51/191.25 (g/10min, conditions fully specified); Group D: R940 800-2000 mPa·s(25℃); Group E: R1800-S 980-3600 mPa·s and 8 other entries — Recommended chart format: 5 side-by-side small-multiple panels, each with an independent vertical axis. The axis titles should specify the complete unit of measurement: A: relative reduction %; B: temperature ℃; C: melt flow g/10min and g/min; D: viscosity of the liquid itself mPa·s; E: viscosity of the liquid itself with mixed units cps/mPas/mm²/s. Do not draw any connecting lines between the 5 panels, and do not use shared axes. Separate the panels with explicit break symbols and the annotation “Measurement bases are not comparable; horizontal conversion is prohibited.”“Not Provided in the Source Text” Checklist: This Checklist Should Be Included in Your Technical Agreement
Same-dimension range intersection (% · 3 objects)
Dimension · %X-axis = dimension %; colored band = target interval where the object can fall; points outside the band = portions that cannot be reached.
- Absolute melt visc…
- Measurement tempe…
- Quantitative incr…
- Overlap segment 15–20%
- X-axis same dimension % ·
- X-axis scale based on this article's max (15–20 %); do not directly compare lengths across articles.
- Absolute melt visc…15–20 %
- Measurement temper…15–20 %
- Quantitative incre…15–20 %
Chart data (source text verbatim)
| Object | Range |
|---|---|
| Absolute melt viscosity values for any system (Pa·s | 15–20 % |
| Measurement temperature / method / matrix grade / equipment for the statement “melt viscosity reduced by 15-20%” | 15–20 % |
| Quantitative increase factor in viscosity for high-filler systems | 15–20 % |
Source textScale 13–22 %
Following item-by-item verification, no numerical data are available in any of the official product documentation, public product data on the official website, or existing public documentation. Treating this as a questionnaire and asking each question one by one will be faster than making assumptions:
Equipment and Shear
| Item | Status |
|---|---|
| Screw speed for any model (rpm, processing section) | Not provided in the source text (the only rpm value is 1200rpm for the preprocessing mixer, not the screw) |
| Shear rate for any model (s⁻¹) | Not provided in the source text |
| Quantitative threshold for “low shear” (L/D, configuration, shear level) | Not provided in the source text |
| Screw configuration / combination recommendations | Not provided in the source text |
| Metering / pumping method for liquid additive (R200) | Not provided in the source text (as stated on the official website R200 page) |
| Selection comparison between twin-screw and single-screw equipment | The source text only states that “plasticizing capacity differs greatly”; no comparison is provided |
| Residence time | Not provided in the source text |
| Melt pressure / die-head pressure values for any model | Not provided in the source text (only “die-head pressure” is listed as a parameter name) |
Viscosity and Rheology
| Item | Status |
|---|---|
| Absolute melt viscosity values for any system (Pa·s) | Not provided in the source text (the R200 data provide only a relative reduction of 15-20%) |
| Measurement temperature / method / matrix grade / equipment for the statement “melt viscosity reduced by 15-20%” | Not provided in the source text |
| Melt viscosity / MFI / torque for the R915 system | Not provided in the source text |
| Test conditions for the melt flow rate of M911 / M915 (temperature/load) | Not provided in the source text (the M830 control group provides: 190/230/255/275℃ + 2.16kg) |
| Specific numerical values for torque rheology | Not provided in the source text (the method is mentioned twice, and both references relate to the hyperdispersant series) |
| Quantitative increase factor in viscosity for high-filler systems | Not provided in the source text (must not be inferred from 15-20%) |
Transparency and Flame Retardancy (inherited from existing public documentation; stated here as in the source text)
not provided in the source text
the synergist does not affect processing
Closing: Turn “Inability to Obtain Numerical Data” into “Access to the Right Personnel”
15-20% (60% filler system),
Therefore, when you obtain a technical document and are preparing to decide whether to proceed with a supplier, ask the following 4 questions first:
- What are the test conditions for absolute melt viscosity? (temperature / method / matrix grade / equipment) — Without these conditions, the values are not comparable.
- What are the load and temperature for MFI? — Only the M830 series provides complete information in the database (190/230/255/275℃ + 2.16kg); the other 2 entries do not include the conditions.
- What is the threshold for “low shear”? — L/D, configuration, and speed range must all be specified; none may be described only qualitatively as “designed for low shear.”
- Who determines the equipment-side parameters? — The source text provides a service pathway: the supplier’s technical personnel will visit the site and define the process parameters according to your extrusion equipment. Including this in the technical agreement is more reliable than requesting an arbitrary screw-speed value.
Finally, the verification conclusions in this article are subject to the same boundaries. The scope of coverage is limited to the publicly available portions of this source text. Any portion for which no data are provided remains in the checklist above; it is not supplemented with experience-based values, and no prediction is made regarding whether a subsequent version will provide them.
Request the conditions that can be verified, and request service terms for matters that cannot be verified. This is the most technically rigorous and honest form of technical cooperation that the source text can support.
Not provided in the source text
Article actions
If this piece was useful, you can leave a mark — the like count comes from our back office at admin.kj9896.com; when the endpoint is unreachable the buttons are disabled and the count shows “—”. No invented figures are ever filled in.
Link: https://kj9896.com/en/news/flame-retardant-melt-viscosity-processing-window
Related reading
- 01Same “0.5–2%,” Two Denominators in Manuals: Why Conductive Carbon Black Additive Dosages Cannot Be Directly Converted11 October 2026
- 02When National Standard FV-2 and UL94 V-2 Are Both Listed: Why Do Both Conclusions Hold for the Same Formulation?11 October 2026
- 03Flame-Retardant Ratings Cannot Be Looked Up in a Table: Loading, Thickness, and UL94 Must Be Considered Together11 October 2026
Products mentioned in this article
- R200R200 Phosphorus Coupling Hyperdispersant R200
- R915R915 PET/PETG Transparent FR R915
- R1800-SR1800-S Hyperdispersant R1800-S
- R100R100 Coupling Dispersant R100
- R100AR100A Multifunctional Filler Activator R100A
- TPSTPS Alkyl Ester Wetting Dispersant TPS
- R912BR912B Halogen-Free Flame Retardant for PET R912B
- R940R940 R940 Unsaturated Acrylate–Polyurethane Reactive Flame Retardant
- R218R218 FR Synergist R218
- Q90Q90 Hydrophilic Agent Q90
Keep reading
More company announcements and product updates are in the newsroom.